Figure 3.
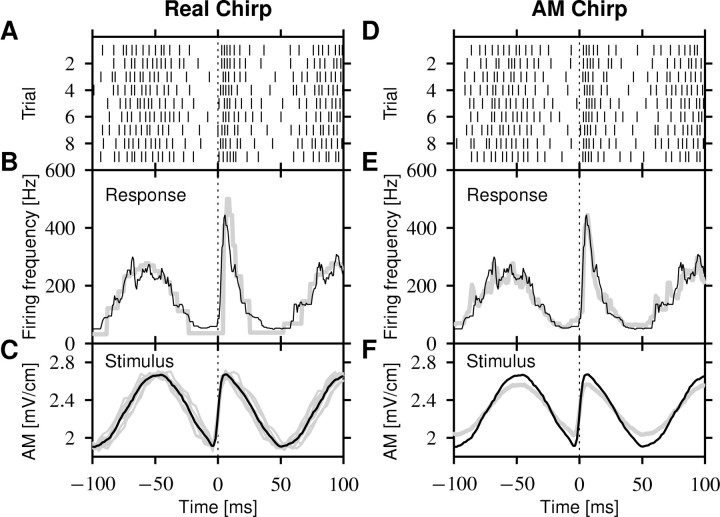
P-unit response to a chirp. The example shows a 60 Hz chirp at the trough of a Δf = 10 Hz beat. A, The spike trains evoked by the presentation of nine chirps at approximately the same beat position of a cell with p = 0.16 (141 Hz baseline firing rate divided by 881 Hz EOD frequency). B, The firing frequency computed as the averaged inverse ISI from the spikes in A (solid line). The gray line is the prediction of the spike-frequency adaptation model Equations 1 and 4. C, The relevant stimulus for the P-unit is the AM of the transdermal EOD. The gray lines are the individual realizations for each of the spike trains in A. The black line is the average stimulus. D-F, Each EOD AM in C was recorded and subsequently presented as a pure AM to confirm that the AM generated by the chirp is the only feature that is encoded by the P-units. D, The spike trains evoked by the AM stimuli. E, The corresponding firing frequency (gray line) is almost identical to the firing-frequency response to the real chirps (black line; same as in B). F, The averaged stimulus for the AMs (gray line) and the real chirps (black line; same as in B) differ in modulation depth because of the asymmetric EOD waveform (see Materials and Methods).

