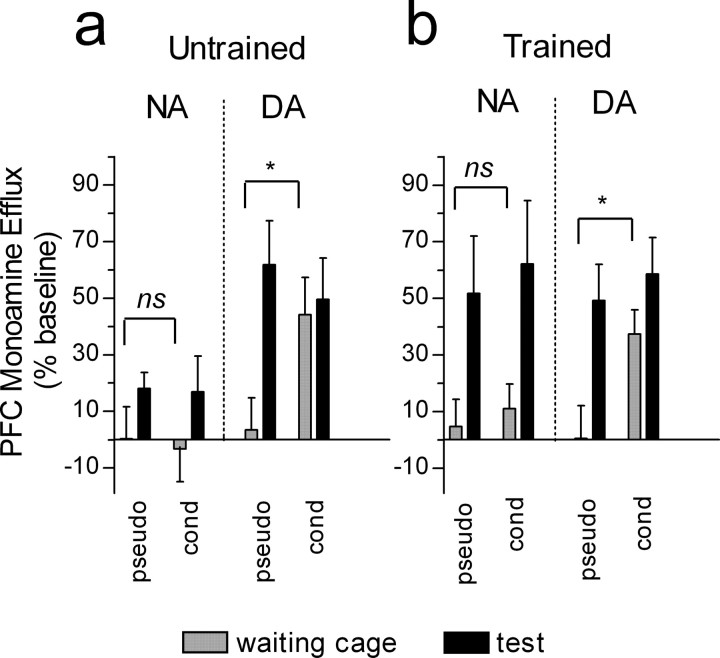
Figure 6.
PFC DA, but not NA, efflux increases in the anticipatory phase of the test in conditioned rats. a, PFC NA and DA levels during the anticipatory phase of the test (waiting cage) and during the test in the T-maze in rats untrained to alternate. b, PFC NA and DA levels during the anticipatory phase of the test (waiting cage) and during the test in the T-maze in rats trained to alternate. Bars represent monoamine levels in 10 min samples, are expressed as the percentage of respective baseline values in each group (average of 4 baseline samples in the home cage), and are means ± SEM of five [pseudoconditioned groups (pseudo)] or nine [conditioned groups (cond)] animals. *p < 0.05 (Student's t test). ns, Not significant. Error bars represent SEM.

