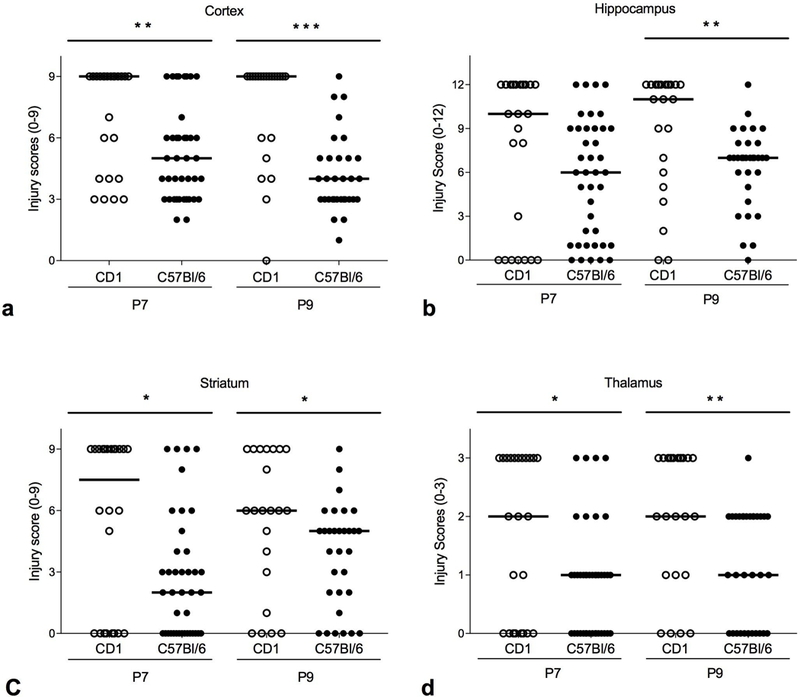
Fig. 2.

Histological injury scores by region. CD1 compared to C57Bl/6J after HI at P7 with 30 minutes of 8% oxygen and CD1 compared to C57Bl/6J after HI at P9 with 50 minutes of 10% oxygen. a Cortex (scale 0–9). Median injury score is higher in CD1 compared to C57Bl/6J in both the P7 model (* p < 0.03) and the P9 model (** p = 0.003). b Hippocampus (scale 0–12). Median injury score is not different between CD1 and C57Bl/6J in the P7 model (p > 0.10), but injury is higher in CD1 compared to C57Bl/6J in the P9 model (** < 0.005). c Striatum (scale 0–9). Median injury score is higher in CD1 compared to C57Bl/6J in both the P7 model (* p < 0.02) and the P9 model (* p = <0.03). d Thalamus (scale 0–3). Median injury score is higher in CD1 compared to C57Bl/6J in both the P7 model (* p < 03) and the P9 model (* p < <0.003). Horizontal line indicates median score.
