
Fig. 5.
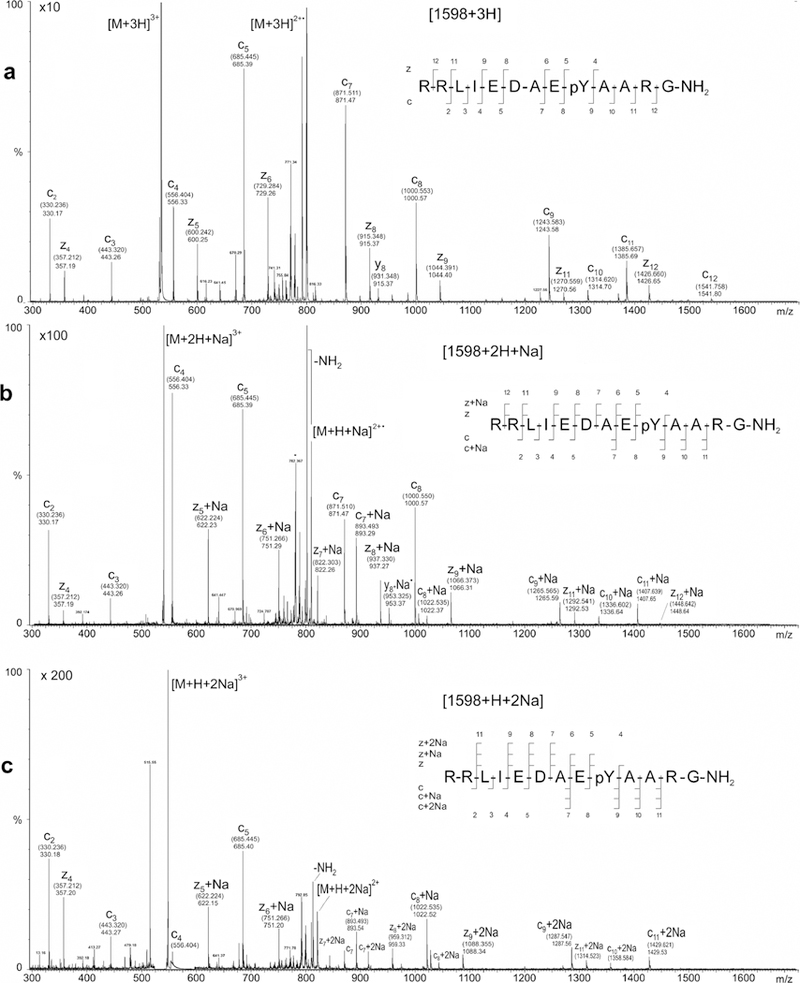
ECD production mass spectra of the (a) triply protonated precursor [M + 3H]3+, (b) singly sodiated precursor [M + 2H + Na]3+, and (c) doubly sodiated precursor [M + H + 2Na]3+ of phosphorylated tyrosine kinase peptide 3. Theoretical m/z values for assigned fragment-ion peaks are enclosed in parentheses; measured m/z values are shown without parentheses