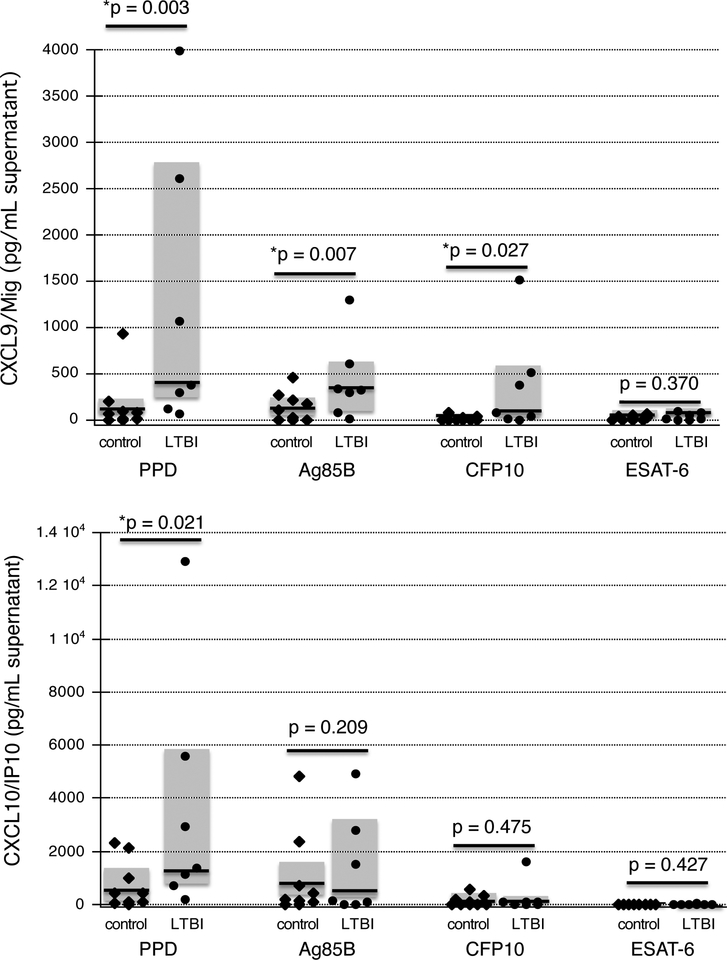
Figure 3: Production of IFNγ-inducible chemokines by baseline BAL cells of individuals with LTBI and naïve controls.
Figures display production of CXCL9 (Mig), 2A, and CXCL10 (IP-10), 2B as determined by ELISA of culture supernatants. Again, findings for individual control subjects are indicated by diamonds, whereas circles indicate results for individual LTBI subjects. Dark horizontal lines indicate median values and shaded boxes represent the 25th percentile to 75th percentile ranges of study results. Baseline BAL cells of subjects with LTBI displayed significantly more production of CXCL9 (Mig) than did those of naïve controls in response to in vivo stimulation with PPD, CFP-10, and antigen 85B, but not in response to ESAT-6 (2A). In contrast, production of CXCL10 (IP-10) by BAL cells from subjects with LTBI was higher than that of control subjects only following stimulation with PPD, and not in response to CFP-10, ESAT-6, or antigen 85B (2B).

