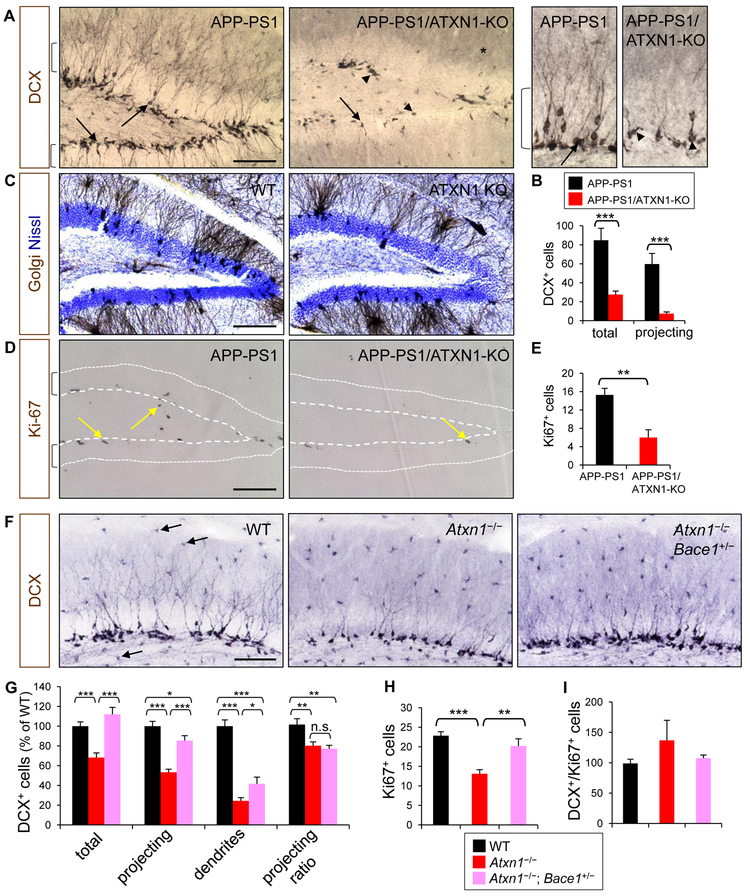
Figure 5. Decrease of adult hippocampal neurogenesis by depletion of Ataxin-1.
(A) Dentate gyrus of APP-PS1 and APP-PS1/ATXN1-KO mice immunolabeled for DCX. Brackets, granular cell layer; arrows, projecting immature neurons; arrow heads, tangential immature neurons. Right panel: high resolution images. *, background DCX immunoreactivity. Bar = 100 μm. (B) Counts of DCX+ (total) and projecting DCX+ cells (projecting) in dentate gyrus per section. Number of mice analyzed, n = 10–12. ***p < 0.001, t-test. (C) Brown, Golgi-stained neurons; blue, Nissl-stained cell nuclei. (D) Ki-67 immunoreactivity (arrows) in dentate gyrus. Area between dots and dashed lines is granular cell layer. (E) Counts of Ki-67+ cells in dentate gyrus. n = 7–8. **p < 0.01. Photomicrographs (F) and quantification (G) of DCX+ neurons in the upper dentate gyrus for their cell bodies in subgranular cell layer (total), projections within granular cell layer (projecting), dendrites in molecular layer (dendrites), and projecting ratio (projecting/total). Each quantification was normalized to WT group (100). Arrows, non-specific immunoreactivity of microglia. n = 6–7. *p < 0.05, **p < 0.01, ***p < 0.001. (H) Number of Ki-67+ cells. (I) Ratio of DCX+ vs. Ki-67+ cells. n = 7–8. See also Figure S5.

