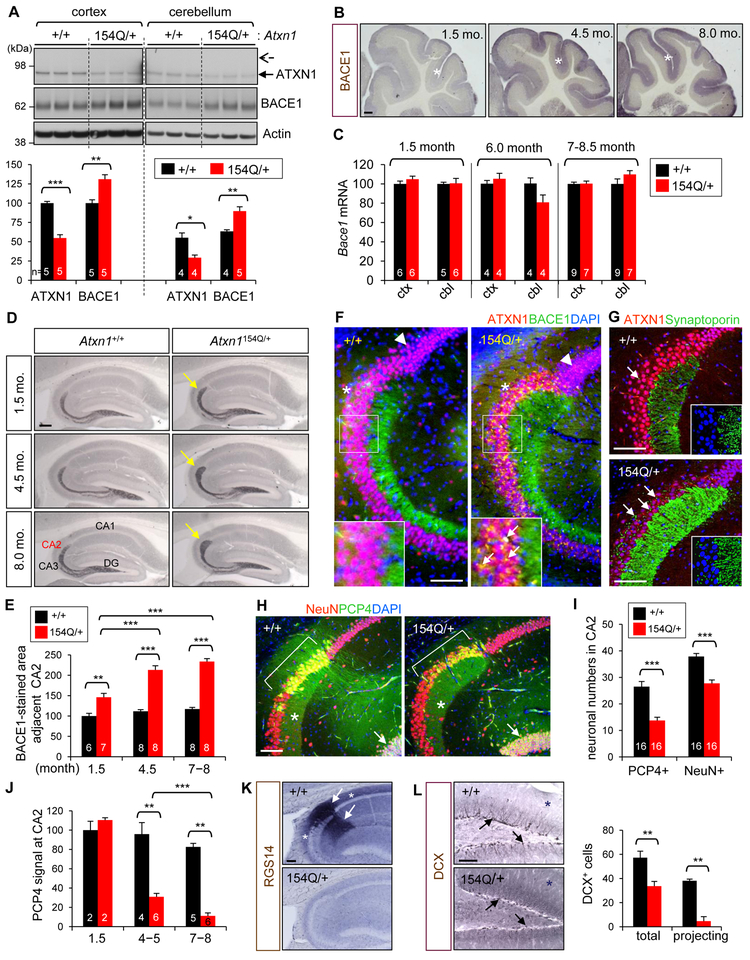
Figure 7. Elevated BACE1 levels and CA2 neurodegeneration in polyQ-expanded Ataxin-1 knockin mice.
(A) Ataxin-1 and BACE1 levels in 6-month-old Atxn1154Q/+ and WT mice. Arrow and dashed arrow indicate the positions of WT (2Q) and mutant (154Q) Ataxin-1, respectively. In bar, number of mice analyzed. *p < 0.05, **p < 0.01, ***p < 0.001, t-test. (B) BACE1 immunolabeled cerebellum of 1.5-, 4.5-, and 8-month-old Atxn1154Q/+ mice. *, molecular layer. Bar = 200 μm. (C) Bace1 mRNA levels in the cortex and cerebellum. Relative value of 100 is given to the cortex and cerebellum of WT at each age group. (D) Hippocampus of Atxn1154Q/+ and WT mice immunolabeled for BACE1. Arrows, BACE1-immunopositive mossy fiber ends. Bar = 200 μm. (E) Quantification of BACE1-immunoreactive area near CA2. In bar, number of brain section analyzed. 1–2 sections/mouse. (F) Hippocampal CA1/CA2/CA3 regions of 8-month-old mice immunolabeled for Ataxin-1 and BACE1. Arrow head, punctate staining of CA1 neurons by Ataxin-1 and DAPI. *, outward shape of CA2 region. Arrows in inset, BACE1 immunoreactivity (yellow signal) in the neuronal soma. Bar = 100 μm. (G) Immunofluorescence signals of Ataxin-1 and synaptoporin, a presynaptic marker. Arrows, synaptoporin+ presynaptic terminals. Insets, high resolution images without Ataxin-1 signal. (H) Hippocampal regions immunolabeled for PCP4 and NeuN, a neuronal marker. Bracket, CA2; *, stratum lucidum; arrow, granular neurons. (I) Counts of PCP4+ neurons and NeuN+ neurons in CA2 regions of 6-9 months-old mice. In bar, numbers of brain section analyzed. 2–4 sections/mouse. (J) Quantification of PCP4 immunoreactivity of CA2 neurons. 1–2 sections/mouse. (K) RGS14 immunoreactivity in 6 month-old mice. Arrows, RGS14+ dendrites of CA2 neurons; *, RGS14+ axons. Bar = 100 μm. (L) Dentate gyrus of 4.5-month-old mice immunolabeled for DCX. Arrows, DCX+ neurons. *, background DCX immunoreactivity. Right: counts of total and projecting DCX+ cells per dentate gyrus. n = 4. See also Figures S6 and S7.

