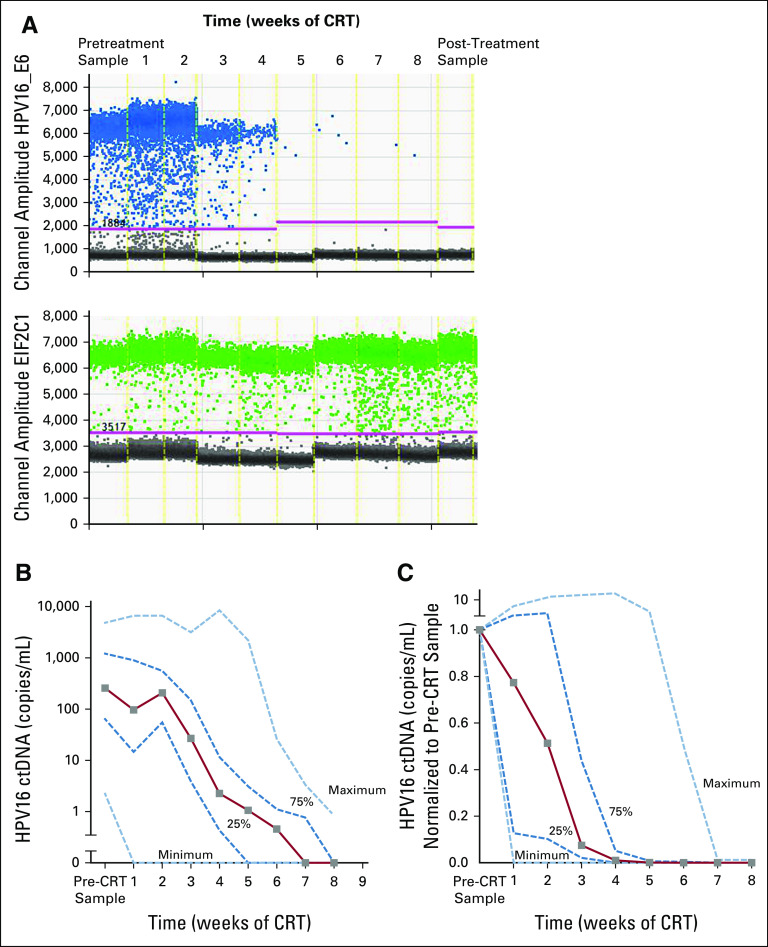
FIG 3.
Human papillomavirus (HPV) droplet digital polymerase chain reaction (ddPCR) assay in monitoring treatment response to chemoradiation (CRT). (A) Amplitude plots of the ddPCR raw data are shown for CRT per week of one patient with oropharyngeal squamous cell carcinoma, starting from pretreatment sample on the left, samples collected per week through 8 weeks of CRT, and post-treatment sample on the right. (B) Graph representing median HPV copies per milliliter at each treatment time point from B along with interquartile range (dark blue dashed lines) and minimum and maximum values (light blue dashed lines) in patients with complete sets of plasma samples (28 patients) every week. (C) Median HPV copies per milliliter measures in patient samples after every week of CRT are represented as a fraction of the same-patient pretreatment sample (28 patients). Light blue dashed lines indicate minimum and maximum values, and dark blue dashed lines show the interquartile range. ctDNA, circulating tumor DNA.

