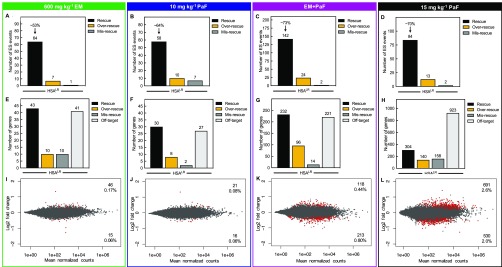
Figure 5.
Combination treatment rescues more mis-splicing events than either drug alone and does not globally disrupt gene expression in the HSALR DM1 mouse model. Global analysis of ES events that showed a greater than 10% change in PSI between WT and HSALR mice were evaluated for mis-splicing rescue (p < 0.01, FDR < 0.1) with (A) 600 mg kg–1 erythromycin, (B) 10 mg kg–1 pafuramidine (PaF), (C) the combination (EM+PaF), and (D) 15 mg kg–1 pafuramidine (PaF) per oral administration daily for 14 days. The number of ES events that showed mis-splicing rescue (black bar) of > 10%, over-rescue (golden rod bar) of > 110% or mis-rescue (gray bar) of < −10% for each treatment are displayed. The average percent rescue for all “rescued” ES events for a given treatment is displayed above the black bar. Global differential gene expression analysis determined via RNA-seq for (E) 600 mg kg–1 erythromycin, (F) 10 mg kg–1 pafuramidine (PaF), (G) the combination (EM+PaF), and (H) 15 mg kg–1 pafuramidine (PaF) versus control HSALR mice. The number of genes that showed expression rescue (black bar) of > 10%, over-rescue (golden rod bar) of > 110% or mis-rescue (gray bar) of < −10% for each treatment are displayed. Off-target (light gray bar) are genes that showed a greater than 10% change in expression and are not typically differentially expressed between WT and HSALR mice (p < 0.1). MAplots of differential gene expression analysis determined via RNA-seq for (I) 600 mg kg–1 erythromycin, (J) 10 mg kg–1 pafuramidine (PaF), (K) the combination (EM+PaF), and (L) 15 mg kg–1 pafuramidine (PaF) versus control HSALR mice. Red dots represent gene with significantly altered expression (p < 0.1). Gray dots represent genes that were not significantly differentially expressed.

