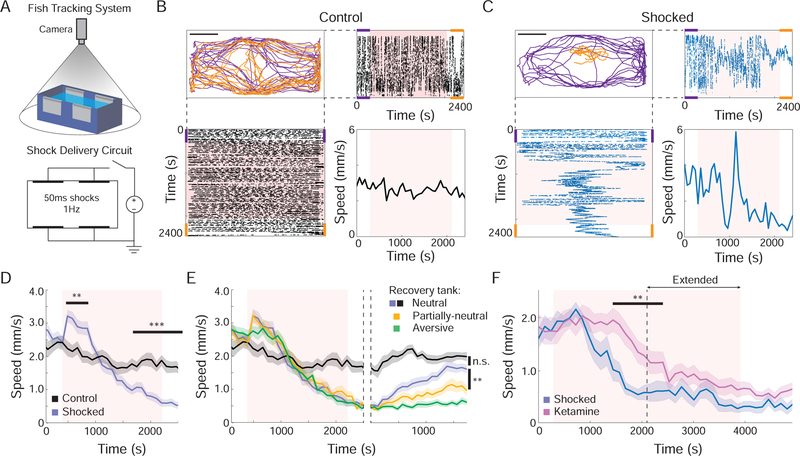
Figure 1: Active-to-passive coping behavioral state transition in larval zebrafish.
(A) BC rig tracks fish position and delivers electric shocks (B and C) The behavioral response of two fish: 0V control fish (B) and 5V shocked fish (C). The path during the pre-shock period (purple) and the post-shock period (orange) (upper left, scale bar = 10 mm). The position along the short (upper right) and long (lower left) sides of tank over the entire protocol (pink shading indicates shock period). Speed of fish in 60 s windows (lower right) shows that BC results in reduced movement. (D) Shocked fish (blue, n=33) increased their speed (AC) in response to the first five minutes of BC (p=5.15 × 10⁻⁶) then transitioned to a reduced mobility state (PC) compared to controls (black, n=14; p=7.03 × 10⁻⁸ at final time point). See also Figure S1A. (E) Fish context was changed post-BC to assess recovery rate (transition indicated with dashed lines). Fish moved to the neutral context (blue) recovered to the level of control fish kept in the same tank (black; p=0.11, n.s.; One-way ANOVA with Holm-Sidak post-hoc comparison; data also in panel D), while fish returned to the aversive context (green, n=40) or the partially-neutral context (yellow, n=29) did not recover compared to shocked fish in the neutral environment (p=2.12 × 10⁻⁸ and p=.003, respectively). (F) Exposure to ketamine one hour before BC (n=16) reduced and delayed the onset of PC compared to controls (n=8, p<0.05 between 7 and 17 minutes post shock), but did not fully prevent the transition when fish were exposed to a longer BC protocol. See also Figure S1B and S1C. In all figures, shaded area and error bars indicate standard error of the mean (s.e.m.) and all statistical tests are Student’s t-tests, unless otherwise indicated (*P<.05; **P<.01; ***P<.001).

