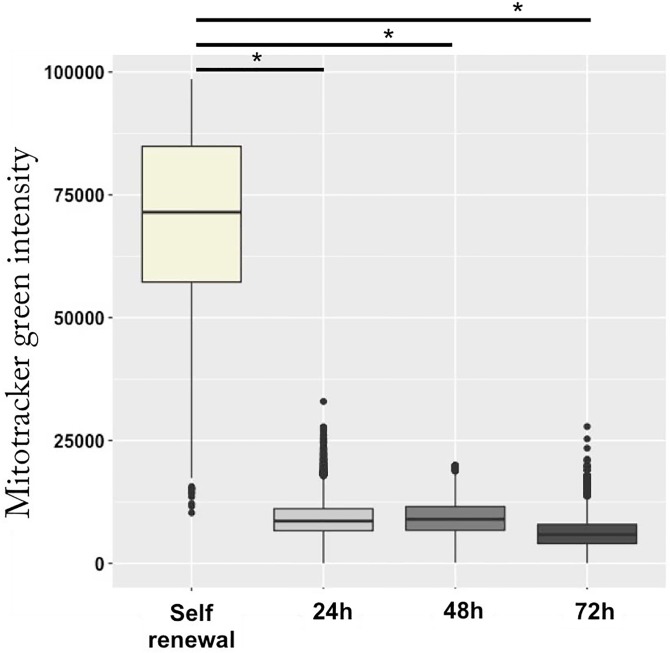
Fig 3. Mitotracker intensity evolution during the erythroid differentiation process.
Shown is the distribution of the mitotracker intensity at each time-point of the differentiation process measured using ImageStreamX. A t-test was applied to assess whether means were significantly different (*: p-value < 0.05). Data were obtained from three independent experiments. 11678 cells were analyzed for the self renewal condition, 12587 cells for 24h, 14147 cells for 48h and 12355 cells for 72h.

