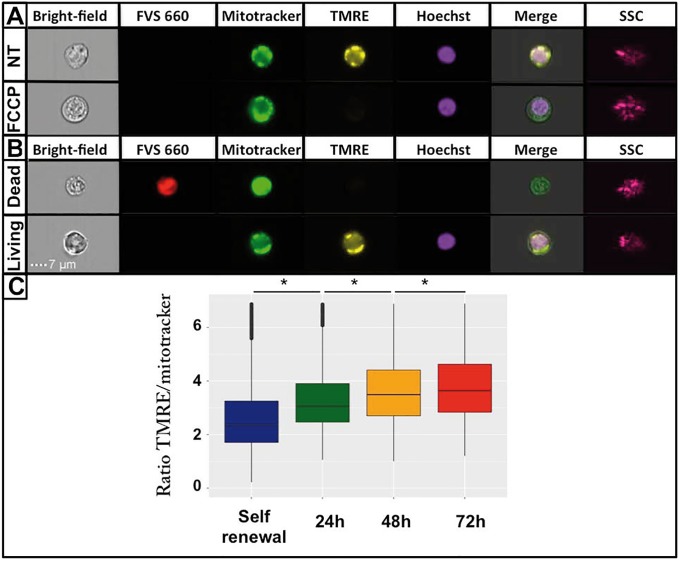
Fig 4. Mitochondrial membrane potential (MMP) evolution during erythroid differentiation.
Cells morphology and size were observed through the bright field channel using ImageStreamX. Dead cells were identified using FVS 660 dye (red). MMP was assessed using TMRE dye (yellow), mitochondrial content was evaluated using green mitotracker intensity (green), and the nucleus was stained using Hoechst (purple). Merge corresponds to the superposition of bright field, TMRE, mitotracker and Hoechst images. Cell granularity was assessed using SSC channel (pink). A: The FCCP uncoupler was used as a negative control of MMP staining. NT: No treatment. B: Shown is an example of FVS 660 staining to discriminate between living and dead cells. C: Boxplots of normalized TMRE distributions. Outliers are not shown. A Wilcoxon test was applied to assess whether means were significantly different (*: p-value < 0.05). Data were obtained from three independent experiments. The overall numbers of cells analyzed were 11678 for the self-renewal condition, 12587 cells for 24h, 14147 cells for 48h and 12355 cells for 72h.

