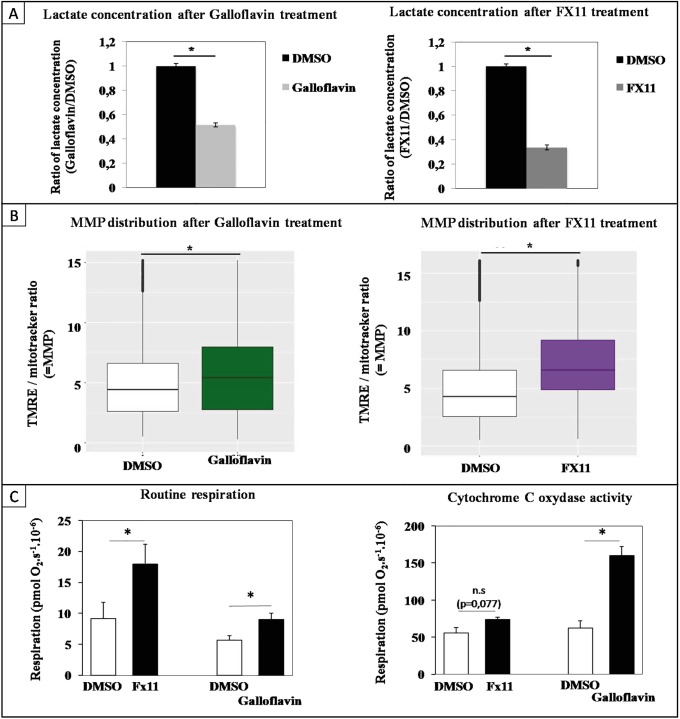
Fig 6. Mitochondrial membrane potential changes following LDHA inhibition.
T2EC were incubated with Galloflavin (30 μM) and FX11 (50 μM) for 24h. A: Lactate concentration was measured in T2EC media following incubation with Galloflavin or FX11 for 24h. Each value represents mean +/- S.D. of six independent experiments for the Galloflavin and five independent experiments for FX11. A t-test was applied to assess whether distributions were significantly different (p-value inf. to 0.05). B: MMP was assessed on living cells (FVS 660 dye) using TMRE dye, normalized by dividing TMRE intensity by mitotracker intensity. FCCP uncoupler was used as a negative control for MMP staining. A wilcoxon-test was applied to assess whether distributions were significantly different (p-value inf. to 0.05). Data were obtained from three independant experiments. The overall numbers of cells analyzed for Galloflavin treatment were respectively 11306 and 11994 cells for the DMSO and Galloflavin conditions. The overall numbers of cells analyzed for FX11 treatment were respectively 10904 and 12858 cells for the DMSO and FX11 conditions. C: Two respiration parameters were assessed in self-renewing T2EC and T2EC treated for 24h with Galloflavin (30 μM) or FX11 (50 μM). Left panel: Routine respiration corresponds to oxygen consumption without any addition. Right panel: Cytochrome C oxydase activity was assessed by subtracting respiration following ascorbate addition from maximal TMPD-related respiration. Bars represent means +/- S.E.M. from five independent experiments. A paired t-test was applied to assess whether means were significantly different (*: p-value inf. to 0.05; n.s.: non significant).

