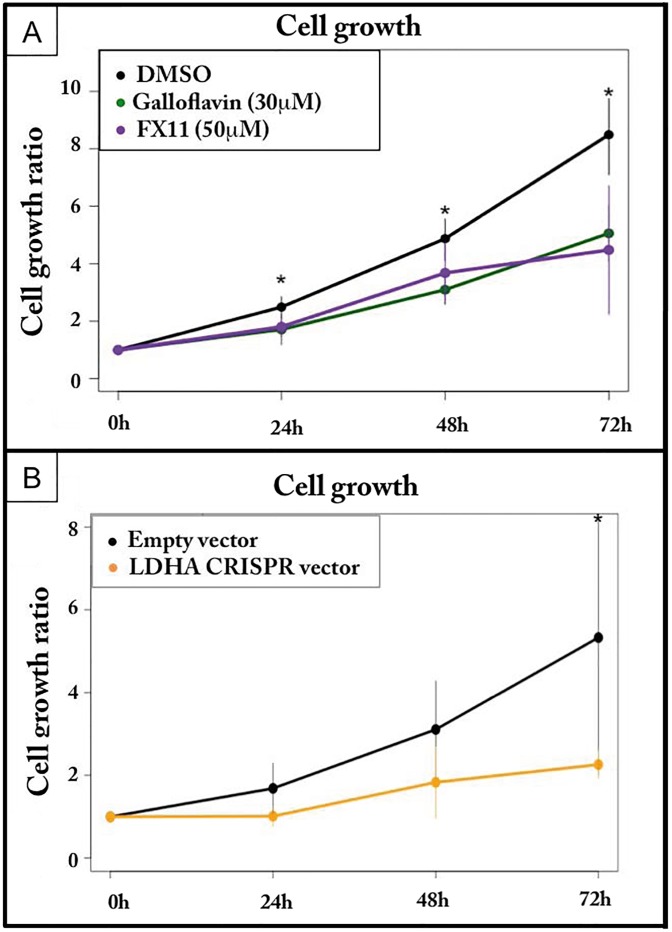
Fig 7. Consequences of LDHA inhibition on the growth of self-renewing cells.
A: Self-renewing T2EC were incubated with Galloflavin or FX11 and were counted every 24 hours for 3 days. Results are the mean +/- S.D. calculated from four independent experiments for FX11, and five independent experiments for Galloflavin. Growth ratios were calculated as the cell number divided by the total cells at day 0. The significance of the difference (p-value inf. to 0.05) between control growth ratios and LDHA inhibitors were calculated using a Wilcoxon test. B: T2EC were transfected with a CRISPR vector directed against LDHA or an empty vector, and were counted every 24 hours for 3 days. The orange curve indicates the growth of T2EC with the CRISPR vector and the black curve indicates the growth of T2EC with the empty vector. The data shown are the mean +/- S.D. calculated from three independent experiments. Growth ratios were calculated as the cell number divided by the total cells at day 0. The significance of the difference (p-value inf. to 0.05) between control growth ratios and LDHA CRISPR were calculated using a t test.

