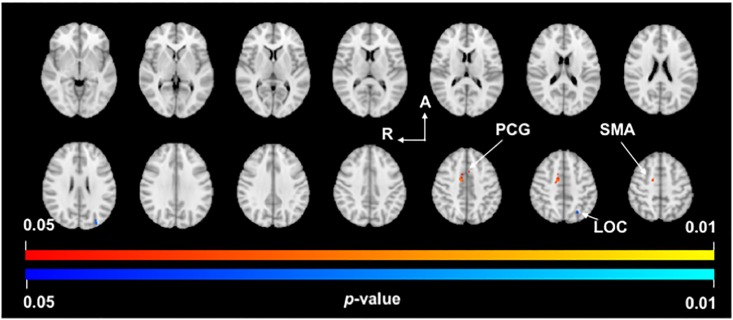
Fig 2. VLp/VA thalamus functional connectivity.
p-value images showing neuroanatomical regions with significant between-group changes in functional connectivity with the VLp/VA thalamus in PD subjects compared to Controls. Warm colors (yellow-orange) represent areas of increased functional connectivity in PD and cool colors (light-dark blue) represent areas of decreased functional connectivity in PD. Spacing between each slice in the z-direction is 4.2mm beginning at z = -3.18 in the top left slice (MNI T1 2mm image). R, right; A, anterior; PCG, paracingulate gyrus; SMA, supplementary motor area; LOC, lateral occipital cortex.

