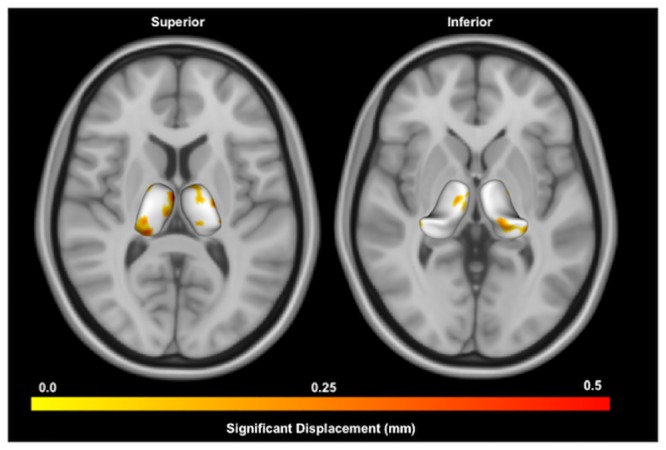
Fig 4. Shape analysis of thalamus in PD compared to Controls.

Displayed are superior and inferior views of bilateral thalami overlaid on axial MNI T1 0.5mm images. Warmer colors indicate regions of greater inflation in the PD group compared to Controls using point-wise significance tests (p < 0.05, uncorrected). No regions were significant after false-discovery rate correction.
