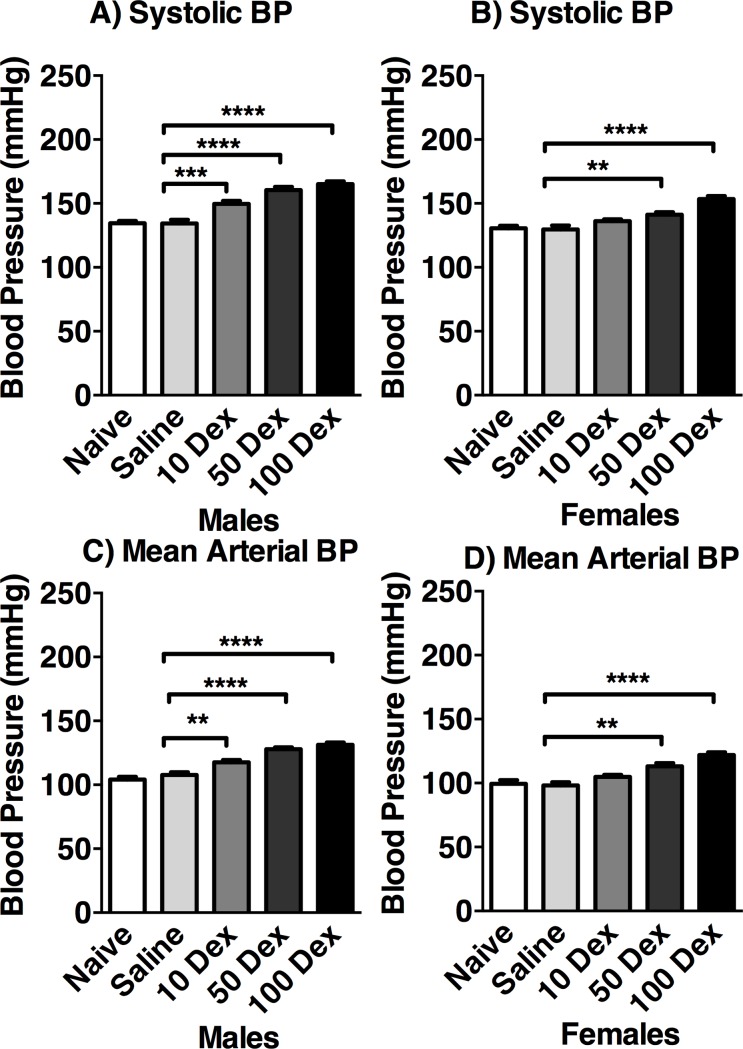
Fig 2. Blood pressure of 19-week-old DEX exposed offspring.
Systolic (A, B) and mean arterial blood pressure (C, D) of male (left) and female (right) naive, saline, 10-DEX, 50-DEX, and 100-DEX offspring are expressed in mmHg. Data are expressed in mean ± SEM. ANOVA: Statistical significance between naive and DEX-treated groups is shown by: * p < 0.05, ** p < 0.01, *** p < 0.001, and **** p < 0.0001.

