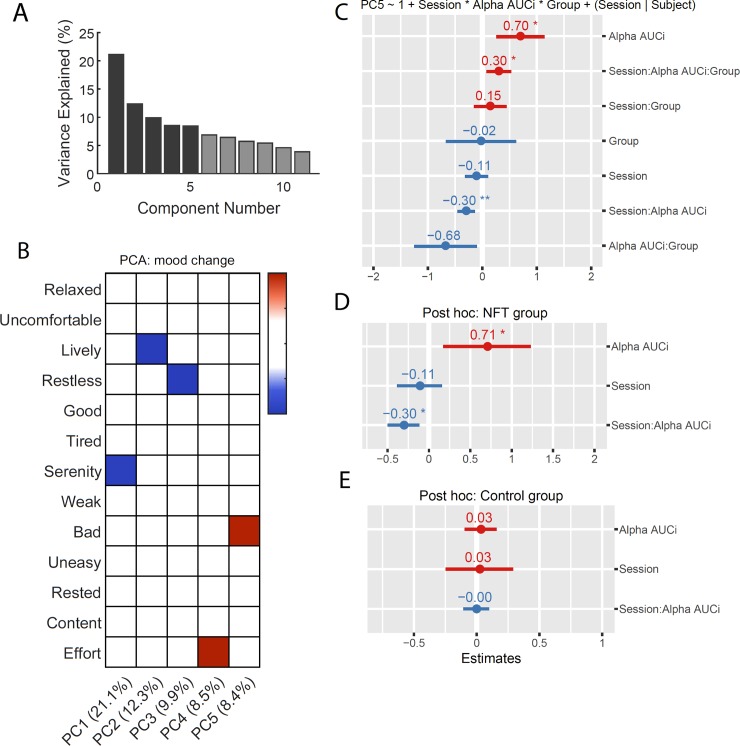
Fig 7. Effects of neurofeedback training (NFT) on mood change.
A) Percentage of variance explained for each principal component (PC). The 5 PCs used result in a total of 60.2% of variance explained (dark-shaded bars). B) Loading matrix for each PC after Varimax rotation. Loadings smaller than 0.4 are not shown. C) Linear mixed effect model for PC5 as the response variable and the triple interaction between session, relative alpha an area under the curve with respect to increase (AUCi) and NFT group (neurofeedback training, experimental group) as predictors. D) Simple effects model for the NFT group. E) Simple effects model for the SF group (sham feedback, control group). For panels C), D) and E) coefficient estimates and standard errors (SE) depicted as dot and line respectively. Red and blue colors represent positive and negative coefficient estimates, respectively. Significance levels: ** p < .01, * p < .05. Significance levels are presented for uncorrected p-values. When Bonferroni correction is applied, to control for Type I errors due to the comparing models for five PCs, the triple interaction term in panel C is no longer significant (pcorrected = 0.152). For panels D and E, when applied, Bonferroni correction controls for two comparisons made in the simple main effects analysis resulting in a significant interaction effect ‘Session x relative alpha’ AUCi (pcorrected = 0.028).

