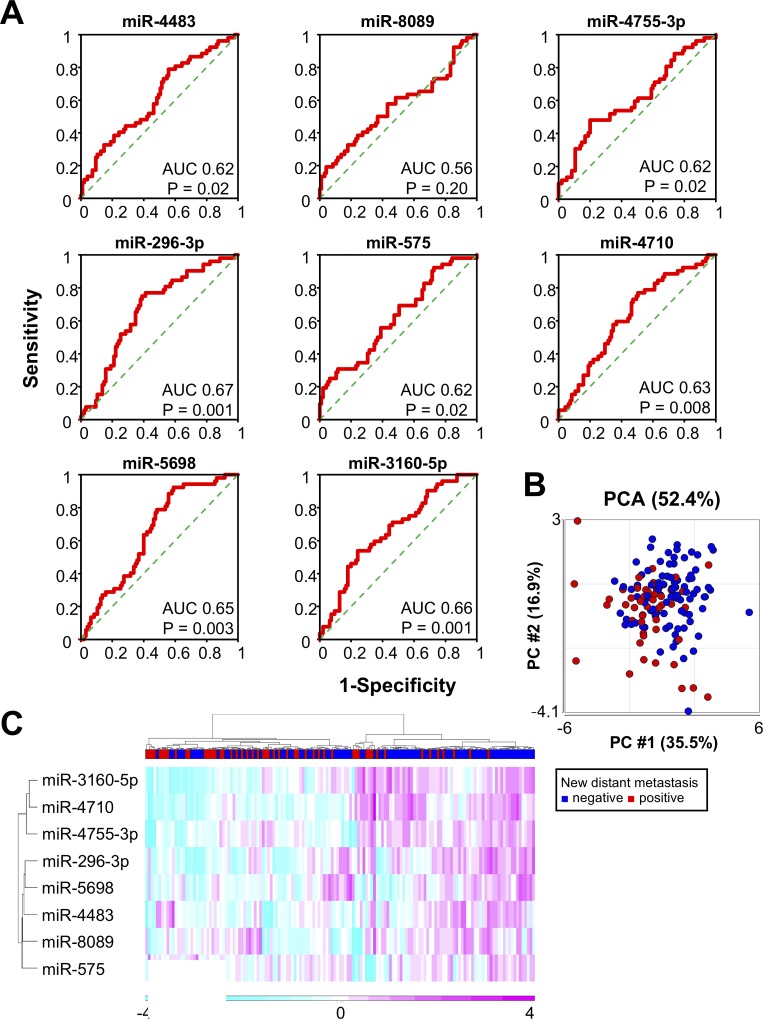
Fig 2. Eight selected miRNAs for the prediction of eribulin responsiveness in metastatic breast cancer.
A. ROC curve analysis of the eight individual miRNAs. AUC and p-values are shown in the plots. B. PCA map of 53 new metastasis-positive samples (red) and 96 new metastasis-negative samples (blue) in metastatic breast cancer patients. C. Unsupervised hierarchical clustering analysis with a heatmap showing 149 metastatic breast cancer samples prior to eribulin treatment with eight selected miRNAs.

