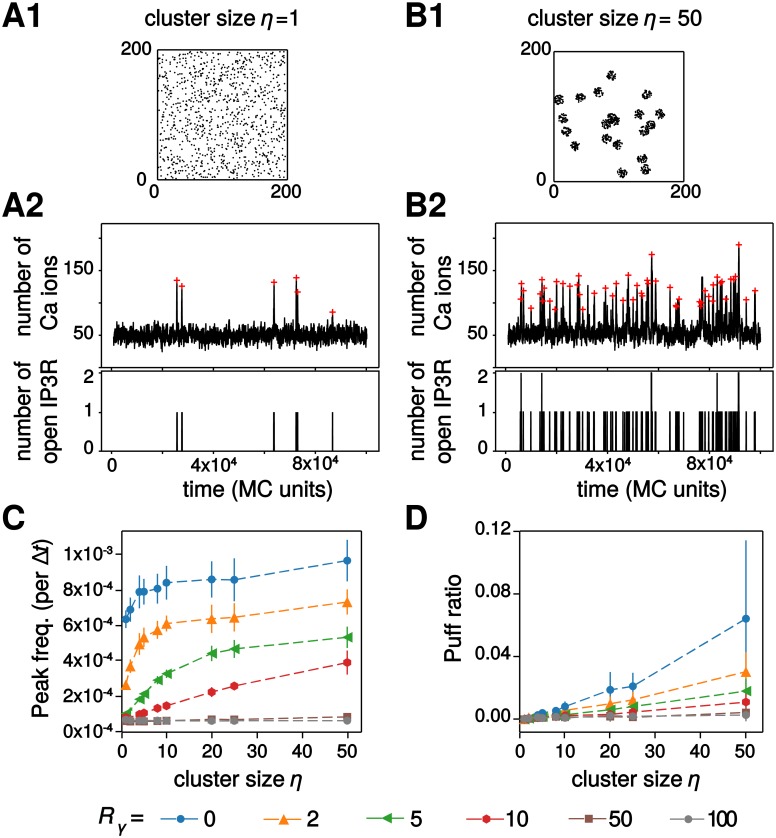
Fig 5. IP3R clustering modulates calcium signals when co-localized.
Representative simulations of the particle-based model with the corresponding IP3R distribution over space, the calcium trace and number of open IP3R for weakly co-localized calcium sources (Rγ = 10) in the case of uniform distribution of the IP3R (A) or strongly clustered IP3R (B) are illustrated. The red crosses show peak locations from automatic detection. The impact of IP3R cluster size η on calcium peak frequency (C) and on the amount of puffs (D) are shown for different values of the cluster size: from η = 1 (IP3R are not clustered) to η = 50 (strong clustering). Data are presented as mean ± standard deviation over 20 simulations. Lines are guide for the eyes. Other parameters: DCa = 0.1 a.u, a1 = 1 a.u, μ = 50 a.u.

