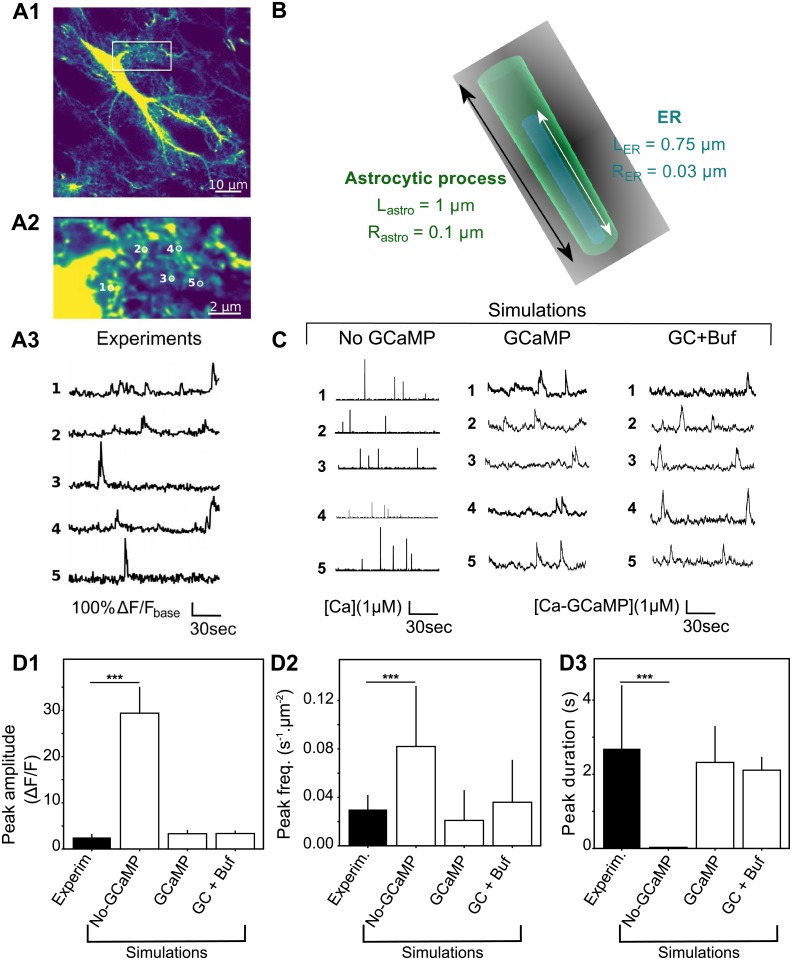
Fig 6. 3d model simulations in fine astrocyte processes successfully reproduce calcium microdomains signals.
(A) Experimental monitoring of the spontaneous local Ca2+ signals in astrocytic sponge-like processes. Panel A1 shows a ‘summed projection’ of a confocal time lapse image stack of a GCaMP6s-expressing astrocyte. Panel A2 illustrates magnification of the boxed region of panel A1. Panel A3 displays spontaneous calcium traces from the regions of interest shown in (A2). (B) The 3d geometry used for the 3D model is a cylinder of length Lastro = 1 μm and radius Rastro = 0.1 μm, with ER as a thinner cylinder inside. The interior volume is roughly 0.03 fL. (C) Representative simulations of calcium dynamics within the above cylinder with the “No-GCaMP”, “GCaMP” and “GC+Buf” simulations. The raw signal corresponds to cytosolic free calcium concentration for the “No-GCaMP” model and to calcium-bound GCaMP concentration for “GCaMP” and “GC+Buf” models. For all simulation types, parameter values were partly taken from the literature and partly adjusted for fitting calcium traces shown in A (reported in Table 2). (D) Quantitative comparisons of the spontaneous calcium signals measured experimentally (black bars) or simulated with the “No-GCaMP”, “GCaMP” or “GC+Buf” models (white bars). The compared quantities are peaks amplitude in terms of ΔF/F ratio (D1), their frequency (measured in min−1 for each μm2 area, D2) and duration (expressed as full width at half maximum, FWHM) D3. Significance is assigned by * for p ≤ 0.05, ** for p ≤ 0.01, *** for p ≤ 0.001.

