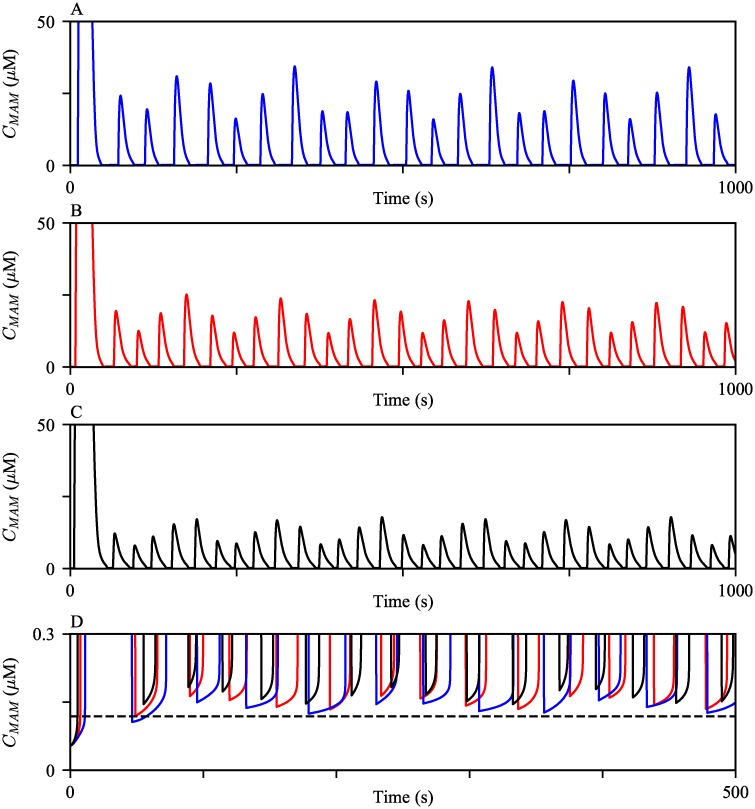
Fig 5. MAM Ca2+ oscillations generated with varying VnSERCA.
The oscillations were generated with (A) VnSERCA = 12 μM s−1, (B) VnSERCA = 10 μM s−1, and (C) VnSERCA = 8 μM s−1. (D) Zoomed in at the basal level of MAM Ca2+ concentration after a spike, with different values of VnSERCA. The black dashed line indicates the cytosolic Ca2+ concentration right after a spike. For all three simulations, the model was given continuous stimulation of IP3 with Ps = 0.3 μM.

