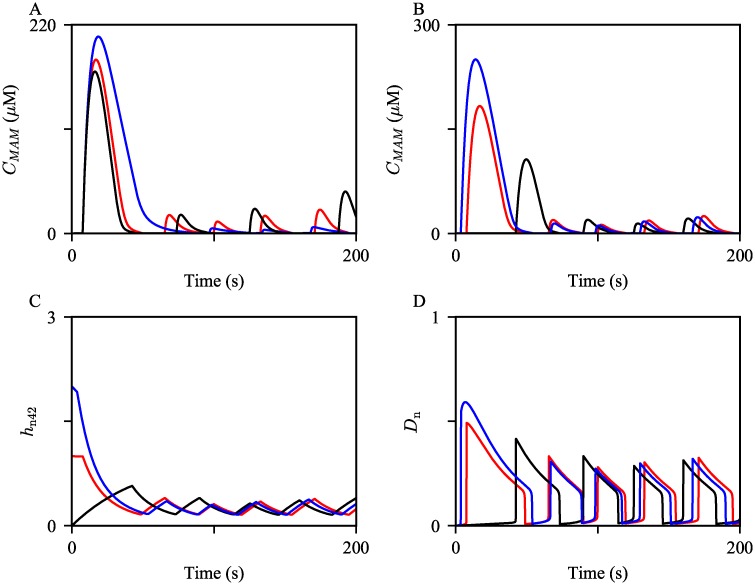
Fig 6. The first few MAM Ca2+ spikes generated with varying HIPR and the initial condition of hn42.
(A) The oscillations were simulated with HIPR = 0.05 (blue), 0.1 (red), and 0.15 (black). (B) The oscillations were simulated with manually tuned hn42(0) = 2 (blue) and 0 (black). The red trajectory is the control, simulated with the steady state initial condition, hn42(0) = 0.99. (C) and (D) show the corresponding timeseries of hn42 and the fraction of MAM IPRs in the drive mode (Dn), respectively, concurrently simulated with the trajectories shown in (B).

