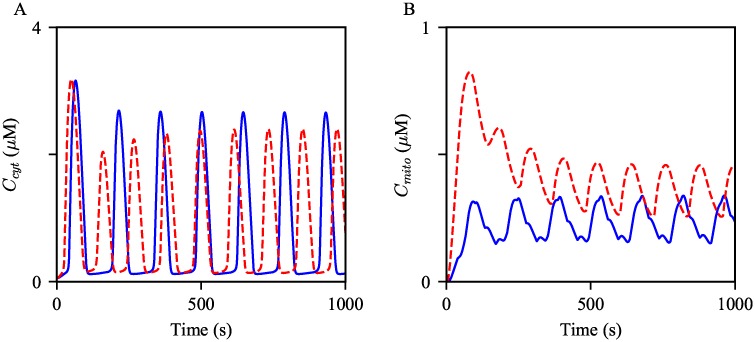
Fig 8. Effects of the cellular changes associated obesity on Ca2+ oscillations.
Oscillations of (A) cytosolic and (B) mitochondrial Ca2+ concentrations generated from the model with different parameter sets. The blue oscillations were generated from the model with the control parameters. The red dashed oscillations were generated with the modified parameters as in Table 2. The model was given continuous stimulation of IP3 with Ps = 0.3 μM.

