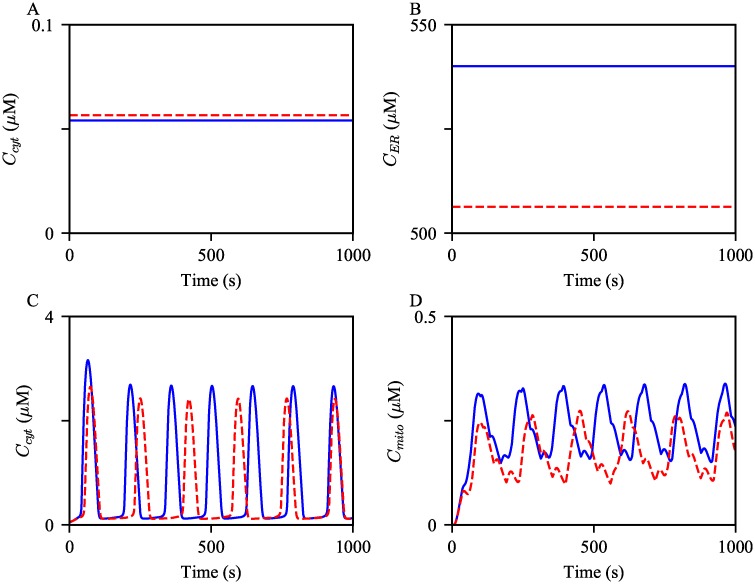
Fig 12. Effects of decreased net SERCA flux on the steady state Ca2+ concentrations and Ca2+ oscillations.
Ca2+ concentrations in (A) the cytosol and (B) the ER at the steady state, Ps = 0 μM, simulated from the control model (in blue) and the model with increased (in red). Oscillations of (C) cytosolic, (D) mitochondrial Ca2+ concentrations generated from the control model, in blue, and with the increased , in red dashed. The model was given continuous stimulation of IP3 with Ps = 0.3 μM.

