Figure 3.

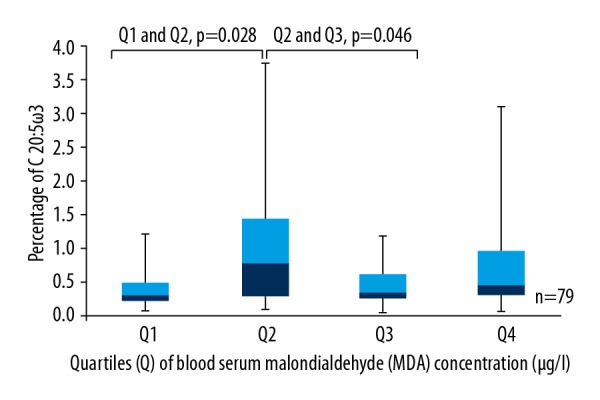
Box plots represent a comparison of the percentage of C 20: 5ω3 between quartiles of blood serum MDA concentration. Q1 and Q2, p=0.028; Q2 and Q3, p=0.046. N=79.

Box plots represent a comparison of the percentage of C 20: 5ω3 between quartiles of blood serum MDA concentration. Q1 and Q2, p=0.028; Q2 and Q3, p=0.046. N=79.