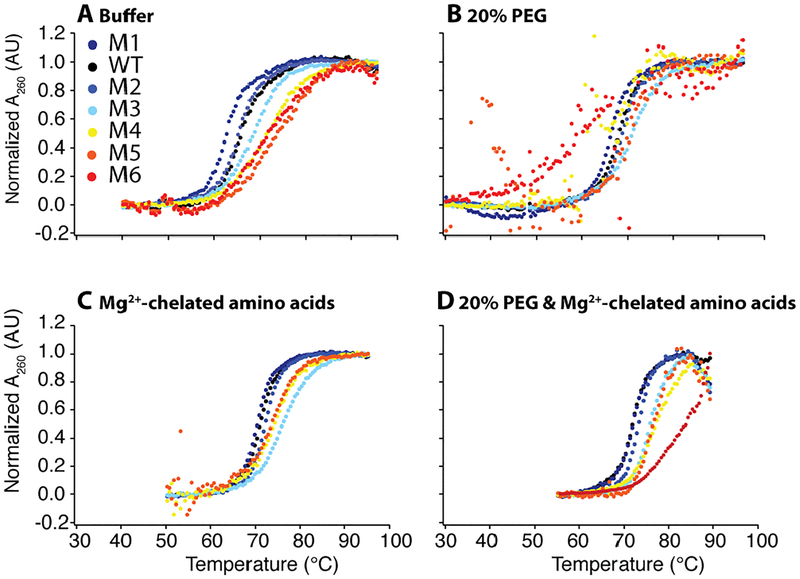
Figure 2.
WT and mutant thermal denaturation under in vivo-like solutions in the background of 2.0 mM free Mg2+. Each construct was globally fit every 2 nm between 250 and 290 nm. Thermal denaturation scans at 260 nm normalized using global fitting parameters in (A) buffer, (B) 20% PEG8000, (C) additional 14.0 mM Mg2+ weakly chelated to amino acids, and (D) 20% PEG8000 and additional 14.0 mM Mg2+ weakly chelated to amino acids. All four panels are in the background of 2.0 mM Mg2+ and 140 mM K+. Low temperature data was truncated in the fitting to avoid excess baselines, as is plotted above.

