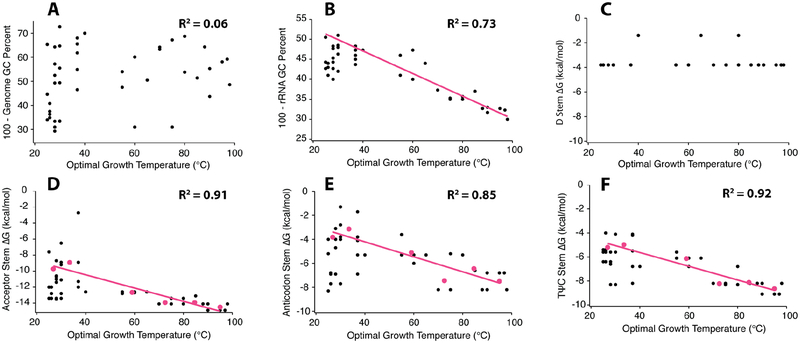
Figure 5.
Analysis of tRNA sequences from organisms with a large range of optimal growing temperatures. A comparison between optimal growth temperature and (A) whole genome GC percent, (B) ribosomal RNA GC percent, and the stability of the (C) D stem, (D) acceptor stem, (E) anticodon stem, (F) TψC stem. In panels B, D-F there are sequence bins based on OGT (pink dots) and threshold DGfolding lines (pink lines) for stem stability as a function of growth temperature, see Materials and Methods for further details.

