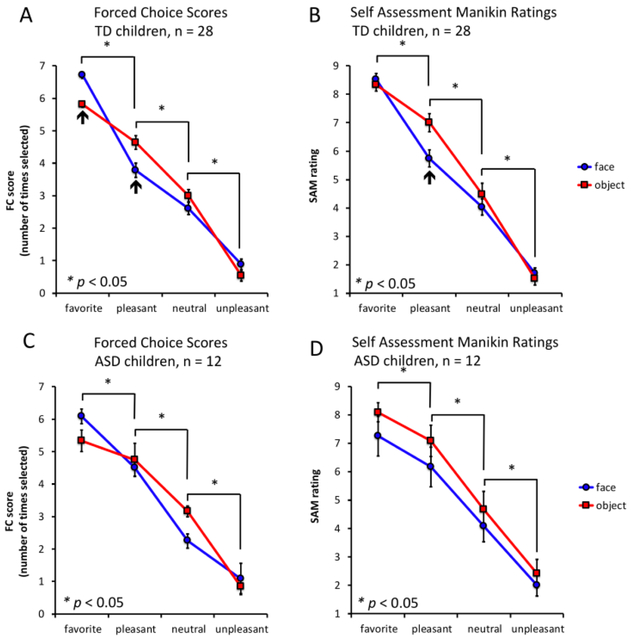
Figure 2. Forced choice and modified Self-Assessment Manikin results in TD (n = 28) and ASD children (n = 12).
Mean forced choice (FC) scores, TD (A) and ASD (C) groups. (A and C) Vertical axes: mean forced-choice score = number of times the image was chosen over all pairwise comparisons; horizontal axes: image categories; blue: face images; red: object images. Favorite images were selected more times than pleasant, neutral and unpleasant pictures in TD children and children diagnosed with ASD who completed the entire task. Mean Self-Assessment Manikin (SAM) ratings for TD (B) and ASD (D) groups. (B and D) Vertical axes: mean SAM rating; horizontal axes: image categories; blue: face images; red: object images. (B) TD children and (D) children diagnosed with ASD rated favorite images higher than pleasant, pleasant more than neutral and neutral more than unpleasant images. For all panels: *p < 0.05, k = 10; black arrows indicate valence categories where there is a significant difference between faces and objects.)

