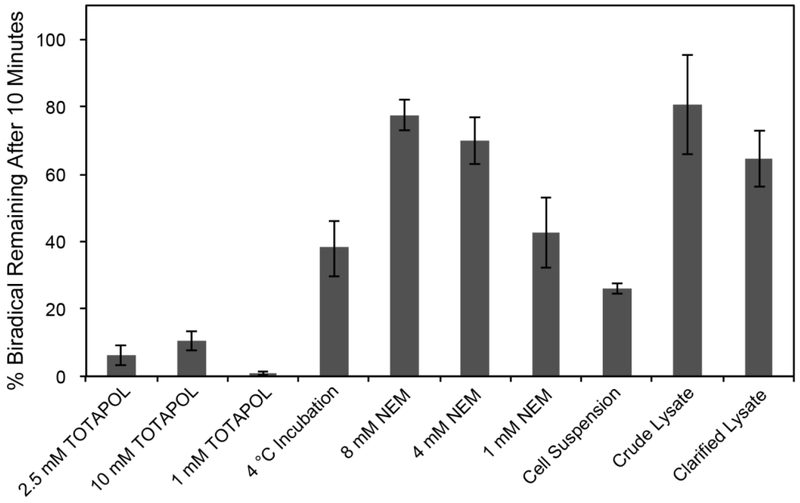
Figure 3:
Graph of percentage active biradical remaining after ten minutes for each experimental condition. Cells and lysates were incubated at room temperature with 2.5 mM TOTAPOL unless otherwise indicated. N = 3 for all conditions. Percentage biradical was calculated from the percentage EPR signal remaining assuming random reduction of each radical center. Error plotted as standard error.

