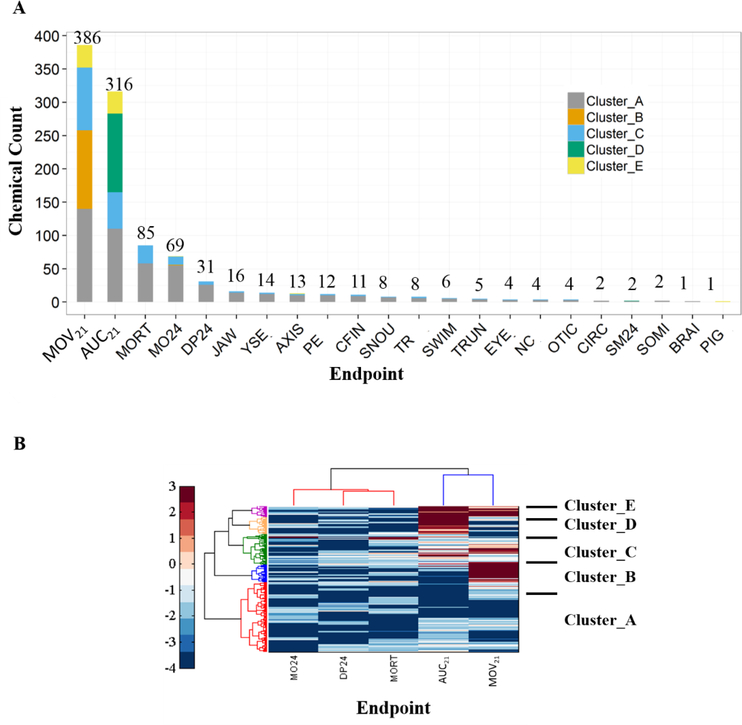
Figure 4.
Chemical clustering and ranking based on the morphology / mortality and 120 hpf behavioral endpoints, and identification of the most sensitive endpoints: (A) Number of chemicals with the minimum BMD10 value for each endpoint and their cluster membership (4B). The number is shown above each bar. (B) Hierarchical clustering based on −log10 (BMD10) values of 1,006 chemicals that had at least one endpoint with a good BMD10 value (10−5 ≤ BMD10 ≤ 103), among the top 5 sensitive endpoints. Chemical clusters are labelled from A to G as shown. Heat map color bar represents −log10 (BMD10) values.

