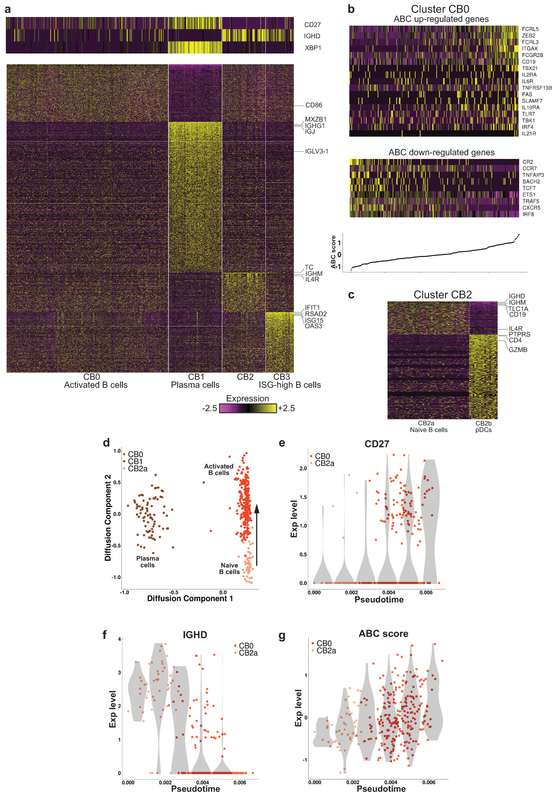
Figure 5.
Focused analysis of kidney B cells. a, Preliminary analysis identified four clusters. The heatmaps show the expression of either canonical markers defining B-cell subsets (top) or genes differentially upregulated in each cluster specifically (bottom). b, The expression of genes previously found to be differentially expressed in ABCs. The top heatmap pertains to genes known to be upregulated in ABCs, the bottom heatmap to genes downregulated in this subset. Columns are sorted by the ABC score, defined as the difference between the average expression of these two sets of genes. The bottom panel shows the ABC score per cell, such that each point on the line corresponds to the heatmap column directly above it. c, Cluster CB2 split into two subclusters, one corresponding to naive B cells (CB2a), the other to pDCs (CB2b). d, Projection of the cells in clusters CB0, CB1 and CB2a onto a two-dimensional plane, using diffusion maps. The arrow represents the hypothesized direction of transition along the trajectory from naive to activated B cells. e-f, The changes in the expression of CD27 and IGHD along the trajectory shown in d. g, The change in the ABC score along this trajectory. In (e)-(g), the violin plots (shades) show the distribution of expression levels in equally spaced intervals along the pseudotime axis (and do not directly correspond to cell clusters).

