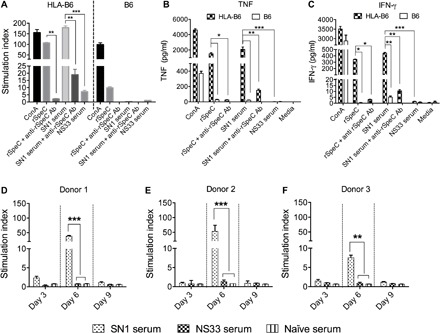
Fig. 2. Mitogenic and inflammatory activity of SN1-infected sera in vitro.

(A) Splenocyte proliferation in response to serum from SN1-infected mice and rSpeC. Splenocytes from HLA-B6 and B6 mice were stimulated in vitro either with 20 μl of sterile-filtered serum from SN1-infected BALB/c mice or with rSpeC. As controls, sterile-filtered serum from mice infected with a SAg-negative GCS isolate (NS33) and Concanavalin A (ConA) were also included. Proliferation of splenocytes was assessed after 72 hours by measuring incorporation of tritiated [3H]thymidine, and data are represented as stimulation indices (see below). The specificity of the response was confirmed by addition of 20 μl of anti-rSpeC serum. Ab, antibody. (B and C) Cytokine profiles following splenocyte proliferation. Cytokine responses of splenocytes from HLA-B6 and B6 mice were measured at 72 hours after incubation with various stimulants. Concentrations of TNF (B) and IFN-γ (C) in the culture supernatants were measured using a TH1/TH2/TH17 cytometric bead array (CBA) kit (BD Biosciences). The specificity of the responses was confirmed by addition of rSpeC antiserum. (D to F) Proliferation of human PBMCs in response to stimulation with serum from SN1- or NS33-infected mice. PBMCs from three different individuals were cultured in the presence of serum collected at various time points following infection with SN1 or NS33. An optimized amount of serum (20 μl) was used for PBMC stimulation. Proliferation was measured by [3H]thymidine uptake after 72 hours. Data are mean ± SEM of three replicates in each experiment, with experiments repeated twice. Stimulation index was defined as counts per minute in the presence of antigen/counts per minute in the absence of antigen. One-way analysis of variance (ANOVA) with Tukey’s post hoc method was used to calculate significance between various groups. *P < 0.05, **P < 0.01, and ***P < 0.001.
