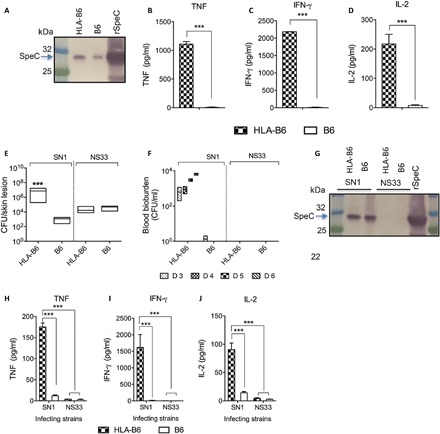
Fig. 3. Infectivity of S. pyogenes SN1 in HLA-B6 mice following intraperitoneal and skin infection.

(A) Western blot analysis of serum from SN1-infected HLA-B6 and B6 mice following intraperitoneal infection. Naïve HLA-B6 and B6 mice (n = 10 per group) were infected with 106 SN1 via the intraperitoneal route of infection. Serum samples were collected at 24 hours after infection and analyzed to detect the toxin. The samples were run on 4 to 12% SDS-PAGE gel. Following protein transfer from the gel, the membrane was probed with rabbit anti-SpeC IgG primary antibody, followed by detection with sheep anti-rabbit IgG-AP, and developed using SIGMAFAST BCIP/NBT substrate. rSpeC protein was also run as a positive control. (B to D) Serum cytokine profile of HLA-B6 and B6 mice following intraperitoneal infection with SN1. The mice infected with SN1 were culled at 24 hours after infection. Blood cytokine levels were measured from the cohort that received 106 SN1 using a CBA kit. TNF, IFN-γ, and IL-2 responses are shown. Statistical analysis was performed using nonparametric, unpaired Mann-Whitney U test to compare the two cohorts. ***P < 0.001. (E and F) Bacterial burden in HLA-B6 mice after skin infection with SN1. Naïve HLA-B6 and B6 mice (n = 10 per group) were infected with SN1 or NS33 via skin. On day 6 after infection, mice were culled and skin bacterial burdens were assessed (E). Mann-Whitney U test used to compare the two cohorts. ***P < 0.001. The presence of systemic infection was assessed by plating blood samples at days 3 to 6 after infection (F). The results are shown as box and whisker plot, where the line in the box indicates the median, the box extremities indicate the upper and lower quartiles, and the whiskers show the minimum to maximum values. (G) Western blot analysis of serum from SN1- or NS33-infected mice. Serum samples collected from SN1- or NS33-infected HLA-B6 and B6 mice were analyzed to detect the presence of SpeC in their serum. The samples were run on 4 to 12% SDS-PAGE gel. Following protein transfer from the gel, the membrane was probed with rabbit anti-SpeC IgG primary antibody, followed by detection with sheep anti-rabbit IgG-AP, and developed using SIGMAFAST BCIP/NBT substrate. The band at 26 kDa in the serum sample from SN1-infected mice corresponds to rSpeC in the positive control sample. (H to J) Cytokine responses in the serum of HLA-B6 and B6 mice following skin infection. Cytokine responses in the serum of HLA-B6 and B6 mice were measured at day 6 after infection with SN1 or NS33. Concentrations of TNF (H), IFN-γ (I), and IL-2 (J) were measured using a CBA kit. One-way ANOVA with Tukey’s post hoc method was used to calculate significance between various groups. ***P < 0.001.
