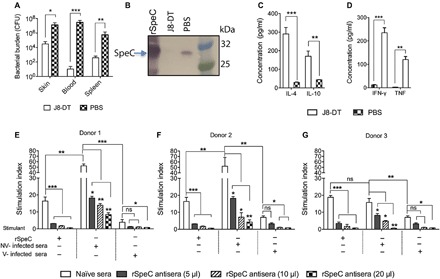
Fig. 4. Abolition of mitogenic and inflammatory effects after J8-DT vaccination.

(A) Protective efficacy of J8-DT vaccine against S. pyogenes SN1 infection. HLA-B6 mice were vaccinated with 30 μg of J8-DT/alum or PBS/alum on days 0, 21, and 28. Two weeks after immunization, mice were infected with SN1 via the skin. On day 6 after infection, mice were culled and bacterial burden in skin (CFU/lesion), blood (CFU/ml), and spleen (CFU/spleen) is shown. Statistical analysis was performed using nonparametric, unpaired Mann-Whitney U test to compare the two cohorts. *P < 0.05, **P < 0.01, and ***P < 0.001. (B) Western blot analysis to detect SpeC in infected mice serum. Pooled serum samples from vaccinated and control cohorts collected at day 6 after SN1 infection were run on 4 to 12% SDS-PAGE gels. Following protein transfer from the gel, the membrane was probed with rabbit anti-SpeC IgG primary antibody, followed by detection with sheep anti-rabbit IgG-AP, and developed using SIGMAFAST BCIP/NBT substrate. The band at 26 kDa in the serum sample from PBS-treated (control) mice corresponds to rSpeC in the positive control sample. (C and D) Cytokine responses in the serum of HLA-B6 mice following skin infection. Cytokine responses in the serum of vaccinated and control HLA-B6 mice were measured at day 6 after infection with SN1. Concentration of IL-4 and IL-10 (C) and TNF and IFN-γ (D) in serum was measured using a CBA kit. One-way ANOVA with Tukey’s post hoc method was used to calculate significance between various groups. ***P < 0.001. (E to G) Assessment of PBMC proliferation induced by serum from vaccinated/control-infected mice. PBMCs from three different individuals were stimulated with pre-optimized concentration of serum from J8-DT–vaccinated SN1-infected (V-infected sera) or nonvaccinated SN1-infected (NV-infected sera) mice. rSpeC was used as controls for stimulation. The specificity of response was assessed by addition of various amounts of rSpeC antisera. PBMCs in the presence of naïve sera were used as a control for specificity of neutralization. Proliferation was measured by [3H]thymidine uptake after 72 hours. Data are mean ± SEM of three replicates in each experiment, with experiments repeated twice. Representative data from two individuals are shown. One-way ANOVA with Tukey’s post hoc method was used to calculate significance. *P < 0.05, **P < 0.01, and ***P < 0.001. ns, not significant.
