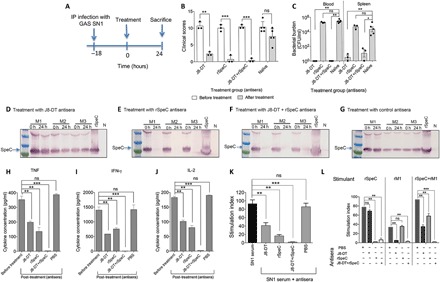
Fig. 5. Therapeutic potential of combination immunotherapy.

(A) Timeline of infection and treatment protocol. (B) Clinical scores for SN1-infected mice before and after antisera treatment. Four cohorts of HLA-B6 mice (n = 3 to 5 per group) were infected intraperitoneally (IP) with 106 S. pyogenes SN1. Eighteen hours after infection (0 hours), mice were scored for clinical symptoms and intravenously administered 200 μl of either anti–J8-DT, anti-rSpeC, a combination of anti–J8-DT and anti-rSpeC, or PBS-treated (control) sera. All mice were again scored for clinical symptoms after treatment to assess disease severity. The scoring system included appearance, level of consciousness, activity, response to stimulus, eyes, respiration rate, and respiration quality. The mice were scored from 0 to 4. The clinical scores for all cohorts before (0 hours) and after (24 hours) antisera treatment are shown. At 24 hours after treatment (42 hours after infection), mice were culled. (C) Bacterial burden in SN1-infected mice before and after antisera treatment. Blood and spleen samples were harvested, processed, and plated for quantification of bacteria. The bacterial burdens in blood and spleen of mice are shown. Mann-Whitney U test was performed to compare each group with the PBS-treated (control) group. *P < 0.05; **P < 0.01; ***P < 0.001; and ns, P > 0.05. (D to G) Assessment of SpeC in serum samples from mice before and after treatments. To assess SpeC neutralization in vivo, sera samples from all cohorts were collected before (0 hours) and then at 24 hours after antisera administration. Pooled serum samples from treated and untreated cohorts were run on 4 to 12% SDS-PAGE gels. Following protein transfer from the gel, the membrane was probed with rabbit anti-SpeC IgG primary antibody, followed by detection with sheep anti-rabbit IgG-AP, and developed using SIGMAFAST BCIP/NBT substrate. The presence of SpeC in HLA-B6 mice treated with J8-DT antiserum (D), rSpeC antiserum (E), J8-DT + rSpeC antiserum (F), or control serum (G) sera before and after treatment is shown. “N” represents pooled serum from naive mice. (H to J) Cytokine profile in SN1-infected mice before and after treatment. Following treatment with various antisera, at 24 hours, mice were culled and cytokine responses in the pre- and post-treatment serum were measured using a CBA kit. Concentration of TNF (H), IFN-γ (I), and IL-2 (J) in serum is shown. Statistical analysis was carried out using one-way ANOVA with Tukey’s post hoc method to calculate significance between various groups, with color of asterisk (*) denoting the groups being compared. *P < 0.05, **P < 0.01; ***P < 0.001; and ns, P > 0.05. (K and L) Splenocyte proliferation and inhibition in response to S. pyogenes antigens and various antisera. (K) Splenocytes from HLA-B6 mice (n = 3) were stimulated with 20 μl of SN1-infected serum. Proliferation was measured in the presence or absence of J8-DT, rSpeC, J8-DT + rSpeC, or PBS-treated (control) sera by [3H]thymidine uptake after 72 hours. Statistical analysis was performed using nonparametric, unpaired Mann-Whitney U test to compare the two groups. ns, P > 0.05; **P < 0.01; and ***P < 0.001. (L) Splenocytes from HLA-B6 mice were stimulated with pre-optimized concentration (5 μg/ml) of rSpeC, rM1, or rSpeC + rM1. To assess inhibition by various sera, 20 μl of J8-DT, rSpeC, or J8-DT + rSpeC antisera was added to each well. Nonimmune sera were used as control. Proliferation of splenocytes in the presence or absence of various antisera was assessed after 72 hours by [3H]thymidine uptake. Data are represented as stimulation indices, which were defined by comparing the proliferation in the presence or absence of antisera. One-way ANOVA with Tukey’s post hoc method was used to calculate significance between various groups. **P < 0.01; ***P < 0.001; and ns, not significant.
