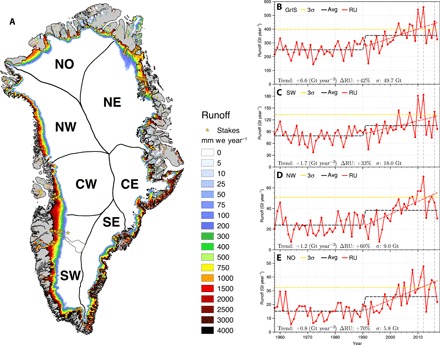
Fig. 1. High-resolution runoff patterns and post-1990 changes.

(A) Annual mean runoff (RU) over the GrIS and peripheral glaciers and ice caps (1958–2017) as modeled by RACMO2.3p2 and statistically downscaled to 1-km horizontal resolution. Yellow stars locate 213 stake sites where SMB is measured. The seven selected sectors of the GrIS derived from (16) are overlaid. (B) Time series of annual cumulative runoff integrated over the GrIS (red). Panels (C), (D), and (E) show the same for the SW, NW, and NO sectors, respectively, of the GrIS [see (A)]. Dashed red lines show linear runoff trends over 1991–2017, and dashed black lines show the averaged runoff over the periods 1958–1990 and 1991–2017, respectively. Dashed yellow lines mark exceptional runoff years, i.e., 3 SDs (σ) above the 1958–1990 mean. Dashed gray lines highlight recent exceptional runoff years over the GrIS, i.e., 2010, 2012, and 2016 (see fig. S7). Individual trends (1991–2017), relative increase in runoff post-1990 (%), and SD (σ) for the period 1958–1990 are listed at the bottom of each subpanel.
