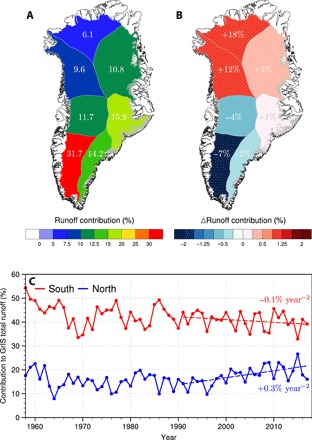
Fig. 2. Regional changes in runoff contribution.

(A) Average contribution of individual GrIS sectors to runoff totals for the period 1958–1990. (B) Post-1990 change in runoff contribution per sector (1991–2017 minus 1958–1990). Sectors experiencing significant change in runoff contribution, i.e., based on Student’s t test (t ≤ 0.10), are stippled with white dots. The post-1990 relative change in runoff contribution is also listed for each sector in white. (C) Time series of runoff contribution for North (blue; i.e., NO + NW) and South (red; i.e., CW + SW) Greenland. Post-1990 trends in runoff contribution are displayed as dashed lines.
