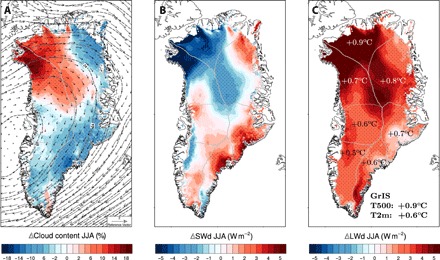
Fig. 4. Recent shift in summer atmospheric circulation and impact on cloudiness.

(A) Post-1990 change in summer cloud content (JJA; 1991–2017 minus 1958–1990) as modeled by RACMO2.3p2 at 5.5 km. Changes in large-scale circulation (black vectors; see inset for wind speed estimation) and in height of the 500-hPa geopotential (dashed black lines) are overlaid. (B) Change in modeled SWd and (C) LWd radiation. In (C), sector-averaged near-surface temperature (2 m) increase is displayed in black and white for southern and northern Greenland, respectively. Average GrIS-wide temperature increase at 500 hPa and at 2-m altitude is listed in the inset. The seven GrIS sectors are outlined in gray in (A) to (C). Stipples highlight regions showing a significant change, i.e., > 1 SD of the 1958-1990 period (σ) in (A) cloud content (σ = 4 g m−2), (B) SWd (σ = 1.9 W m−2), and (C) LWd (σ = 1.7 W m−2).
