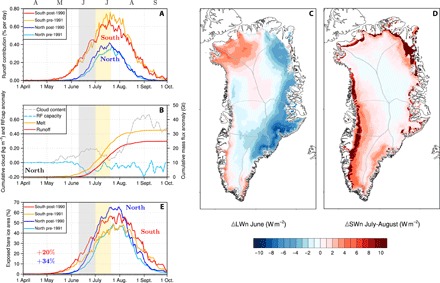
Fig. 5. Increased early-summer cloudiness triggers runoff amplification in north Greenland.

(A) Time series of daily (April-September) mean runoff contribution to GrIS totals for periods 1958–1990 and 1991–2017 in South (orange and red; i.e., CW + SW sectors) and North (cyan and blue; i.e., NO + NW sectors) regions. (B) Time series of daily (April-September) cumulative anomalies (1991–2017 minus 1958–1990) in surface melt (orange) runoff (red) for the North region (NO + NW sectors; right y axis). Dashed gray and cyan lines (left y axis) show cumulative anomalies in cloud content and refreezing capacity, i.e., the fraction of meltwater and rainwater retained and/or refrozen in the firn. Anomalies in (C) June LWn and (D) July-August SWn. (E) Daily exposed bare ice area post-1990 and pre-1991 for the South (red and orange) and North (blue and cyan) regions expressed as a fraction (%) of the ablation zone area. Numbers at the bottom left corner of (E) express the relative increase (%) in maximum bare ice area post-1990 for North (blue) and South (red) Greenland. In (A), (B), and (E), the gray and yellow shades outline the period during which runoff contribution of North Greenland significantly increases (A) under high and low cloudiness successively (B).
