
Fig. 5. Cooperative bortezomib binding detected by ITC experiments.
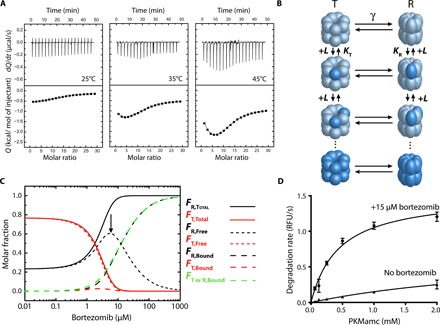
(A) Calorimetric titrations for the interaction of TtClpP (10 μM in the calorimetric cell) with bortezomib (1.4 mM in the injecting syringe) in 50 mM Hepes (pH 7.6) and 50 mM NaCl. Experiments were performed at three different temperatures: 25°, 35°, and 45°C. Thermograms (thermal power as a function of time) are displayed in the upper plots, and binding isotherms (ligand-normalized heat effects per injection as a function of the molar ratio, [L]T/[P]T) are displayed in the lower plots. The binding isotherms were analyzed with the MWC model for TtClpP, consisting of 14 identical subunits, each one containing a single ligand-binding site. Nonlinear least squares regression analysis allows the determination of the following binding parameters (see Table 1): association constants for the R and T states (KR, KT), binding enthalpies to the R and T states (ΔHR, ΔHT), conformational equilibrium constant and conformational enthalpy change between states R and T (γ, ΔHγ), and fraction of active protein (N). (B) MWC model for a 14-mer oligomeric protein. The protein can populate only two conformational states in equilibrium (with equilibrium constant γ): all subunits in R (relaxed, ellipsoidal shape) conformation or all subunits in T (tense, spherical shape) conformation. Subunits have a single ligand-binding site, exhibiting the R conformation a higher binding affinity (KR > KT). Ligand binding occurs through an independent (noncooperative) fashion within an oligomer (ligand-free subunits in light blue and ligand-bound subunits in dark blue). T conformation is favored at low ligand concentration; the higher ligand-binding affinity for R conformation promotes a highly cooperative compulsory concerted conformational change driven by ligand binding and involving all subunits within an oligomer, displacing the equilibrium toward the R conformation. (C) Molar fraction of the different protein species (total, ligand-free, and ligand-bound R and T conformations) as a function of ligand concentration: total fraction of subunits in R conformation (continuous black line), total fraction of subunits in T conformation (continuous red line), fraction of subunits in ligand-bound R conformation (dashed black line), fraction of subunits in ligand-bound T conformation (dashed red line), fraction of ligand-free subunits in R conformation (dotted black line, highlighted with an arrow), and fraction of ligand-free subunits in T conformation (dotted red line). In addition, the fraction of ligand-bound subunits in either R or T conformation is shown (dashed green line). It is obvious that the contribution of subunits in T conformation to the ligand binding is very small (dashed red line). At very low ligand concentration, 77% of the protein subunits are in T conformation and 23% are in R conformation, according to the value of the equilibrium constant γ equal to 3.3. At low ligand concentration, the total fraction of subunits in R conformation increases, while the total fraction of subunits in T conformation decreases due to the T→R conversion. However, both the fractions of ligand-bound subunits in R and T conformation increase due to ligand binding (although the increment in ligand-bound subunits in T conformation is negligible). At high ligand concentration, the total fraction of subunits in R conformation further increases, while that of total subunits in T conformation decreases, and the fraction of ligand-bound subunits in R conformation further increases due to ligand binding, but the fraction of ligand-bound subunits in T conformation decreases due to the T→R conversion. The fraction of ligand-free subunits in R conformation dominates this region, with a maximal population of 60%. This is due to the concerted conversion of subunits within a given protein oligomer (all subunits within an oligomer undergo the conformational change T→R, although not all of the subunits bind a ligand). At very high ligand concentration, the fraction of ligand-bound subunits in R conformation dominates the conformational ensemble, reaching a maximal population of 100%. The R↔T equilibrium shows a switchover or crossover point (R and T are equally populated) at around 2 μM free bortezomib concentration. (D) TtClpP (1 μM complex) peptidase activity was measured as a function of PKMamc concentration in the presence (15 μM) and absence of bortezomib.