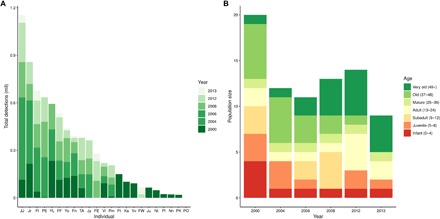
Fig. 3. Face detection and recognition results.

(A) Histograms of detection numbers for individuals in the training and test years of the dataset (2000, 2004, 2006, 2008, 2012, and 2013). (B) Output of model for number of individuals detected in each year and proportion of individuals in different age categories based on existing estimates of individual ages.
