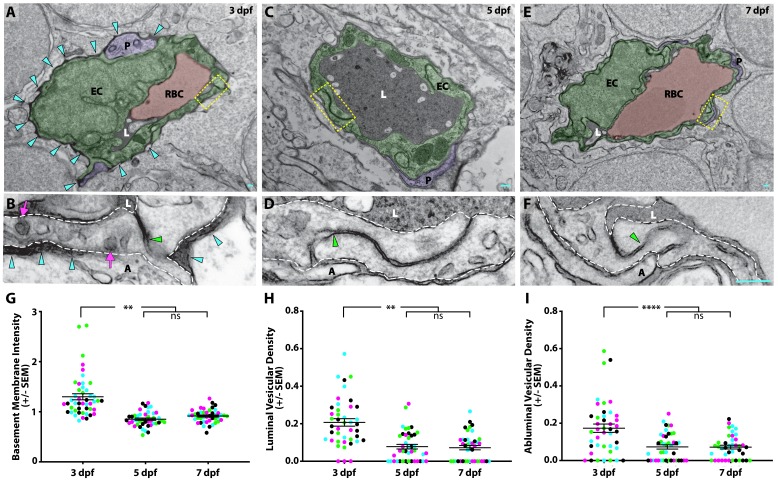
Figure 3. Suppression of transcytosis determines the timing of functional BBB formation.
(A, C, E) TEM images of individual blood vessel cross-sections after injection of electron-dense gold nanoparticles at 3 dpf (A), 5 dpf (C), and 7 dpf (E). Endothelial cells (EC) are pseudo-colored green, pericytes (P) are pseudo-colored purple and red blood cells (RBC) are pseudo-colored red when present in the lumen (L). Turquoise arrowheads highlight the gold-filled basement membrane at 3 dpf (A). (B, D, F) High magnification images (25000x) of the areas boxed in A, C, and E, respectively, with the endothelial cells outlined with white dashed lines. The images are oriented with the lumen (L) on top and the ablumen (A) on the bottom. Tight junctions are functional as early as 3 dpf (B), as seen by their ability to halt the gold nanoparticles at the so-called ‘kissing point’ (green arrowhead), and remain functional throughout development (D and F). Even though the tight junctions are functional at 3 dpf, the endothelial basement membrane is filled with electron-dense gold nanoparticles (B, turquoise arrowheads). This appears to be due to an elevated level of luminal and abluminal gold-filled vesicles (magenta arrows). The scale bars represent 200 nm. (G) Quantification of the endothelial basement membrane gold intensity normalized to luminal gold intensity. (H and I) Quantification of the vesicular densities both on the luminal (H) and abluminal (I) membrane of endothelial cells reveals a suppression of vesicular densities beginning at 5 dpf that remains constant at 7 dpf. N = 4 fish, each marked with a different color, with at least 10 blood vessels quantified for each fish and displayed as single points. ****p<0.0001, **p<0.01, ns is not significant by nested one-way ANOVA.

