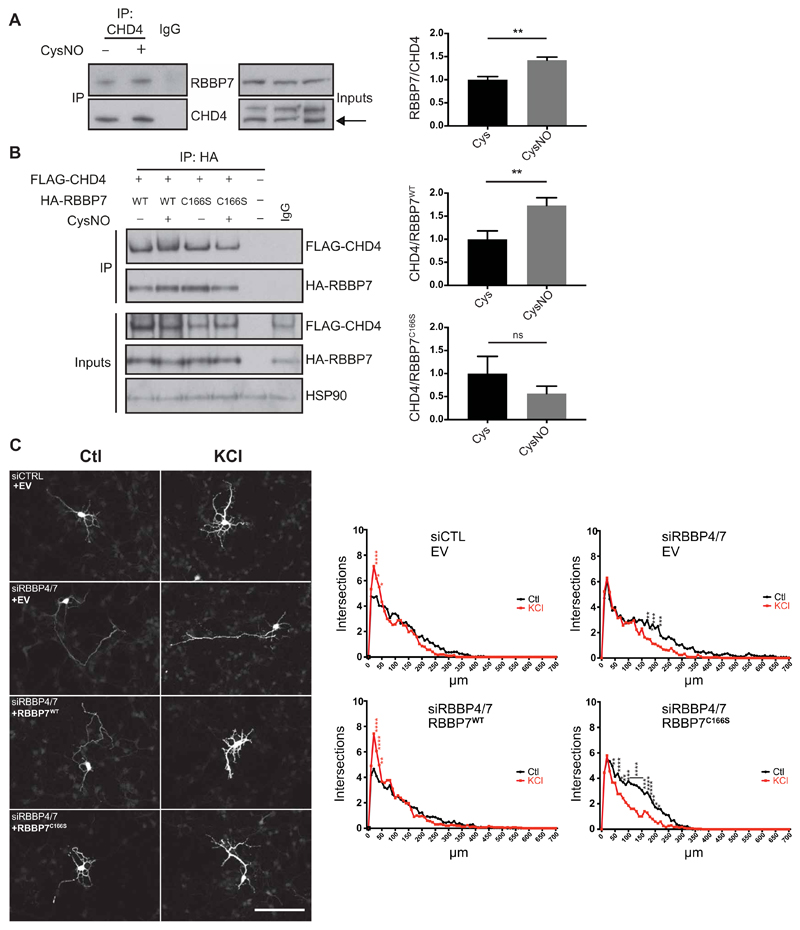
Fig. 5. S-nitrosylation of RBBP7 regulates dendritogenesis.
(A) E17 rat cortical neurons were cultured for 4 days, treated with 200 μM CysNO for 20 min, and subjected to coimmunoprecipitation (co-IP) using CHD4 antibody. As a control, pooled samples of Cys and CysNO were subjected to IP using an immunoglobulin G (IgG) antibody. Western blot analysis was carried out on eluates and inputs using the indicated antibodies. Densitometry analysis of coimmunoprecipitated RBBP7 was shown in relation to coimmunoprecipitated CHD4 (n = 4, **P < 0.01 by unpaired t test). Densitometry was carried out by the normalizing RBBP7 pulldown signal to RBBP7 inputs and dividing this value by the pulldown signal for CHD4. (B) S-nitrosylation of RBBP7 at Cys166 promotes the interaction with CHD4. HEK293T cells were transfected with vectors expressing Flag-mCHD4 and HA-RBBP7WT or HA-RBBP7C166S and treated with 200 μM CysNO for 20 min, and pulldown was carried out on eluates using an HA antibody. Western blot analysis was carried out on eluates and inputs using the indicated antibodies. Densitometry analysis of FLAG-CHD4 was shown in relation to HA-RBBP7 and normalized to FLAG-CHD4 inputs (n = 3, **P < 0.01 unpaired t test). Densitometry was carried out by normalizing FLAG-CHD4 pulldown signal to FLAG-CHD4 inputs and dividing this value by the pulldown signal for HA-RBBP7. ns, not significant. (C) S-nitrosylation of RBBP7 promotes dentritogenesis in cortical neurons. Control small interfering RNA (siRNA) (Ctl) or siRNAs targeting RBBP4 and RBBP7 (siRBBP4/7) were transfected into E15 mouse cortical neurons alongside a green fluorescent protein (GFP) expression vector, and either an empty vector (EV), a vector expressing siRNA-resistant myc-RBBP7WT or myc-RBBP7C166S. Neurons were maintained in control conditions (Ctl) or exposed to 50 mM KCl for 2 days and immunostained for GFP. Resulting images were analyzed using a Fiji Sholl plugin. Maximal projections of representative neurons for each condition. Scale bar, 100 μm. Summary of Sholl data analysis for each condition is shown. n = 3 biological replicates from which 10 neurons each were analyzed (n = 30 neurons in total). Data are mean values for number of intersections (intersections) against distance from the soma (in micrometers). Readings were taken every 10 μm. *P < 0.05, **P < 0.01, ***P < 0.001, and ****P < 0.0001. Red asterisks indicate that the KCl value is significantly greater than that of Ctl, and black asterisks indicate that the Ctl value is significantly greater than that of KCl. Row means two-way ANOVA with Sidak’s test for multiple comparisons.

