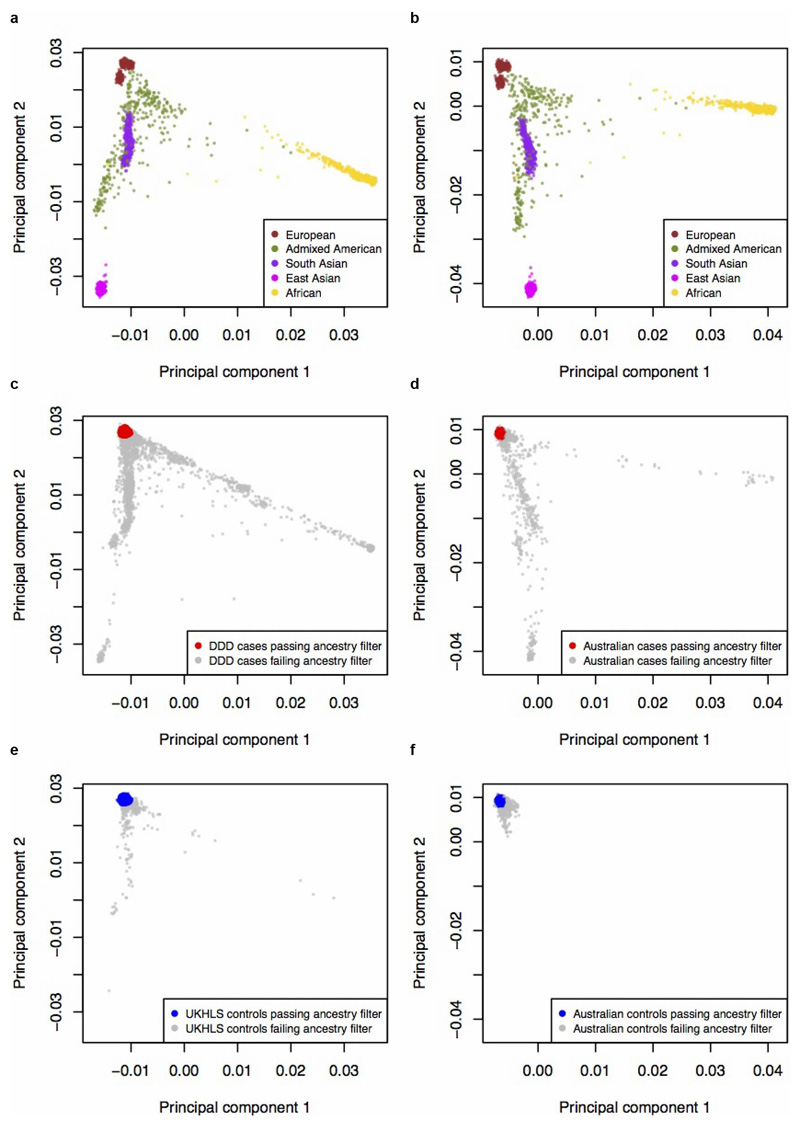
Extended Data Figure 1. Ancestry principal components analysis of UK and Australian samples.
Reference samples (N=2,504) from 1000 Genomes Phase 3, coloured by the five super populations, used for a projection PCA of (a) UK cohorts (DDD and UKHLS), or (b) Australian cohorts c, All DDD cases (discovery N=11,304 and from trios N=930), and d, all Australian cases (N=2,283) from their respective projection PCA with 1000 Genomes. Case samples with European ancestry are plotted in red and non-Europeans in grey. e, All UKHLS controls (N=10,396) and f, all Australian controls (N=4,274) from their respective projection PCA with 1000 Genomes. Control samples with European ancestry are plotted in blue and non-Europeans in grey. All cases and controls coloured in grey (panels c, d, e and f) were excluded from analysis due to non-European ancestry. UK cohorts are plotted after removal of samples that failed quality control, and Australian cohorts before removal of samples failing quality control.

