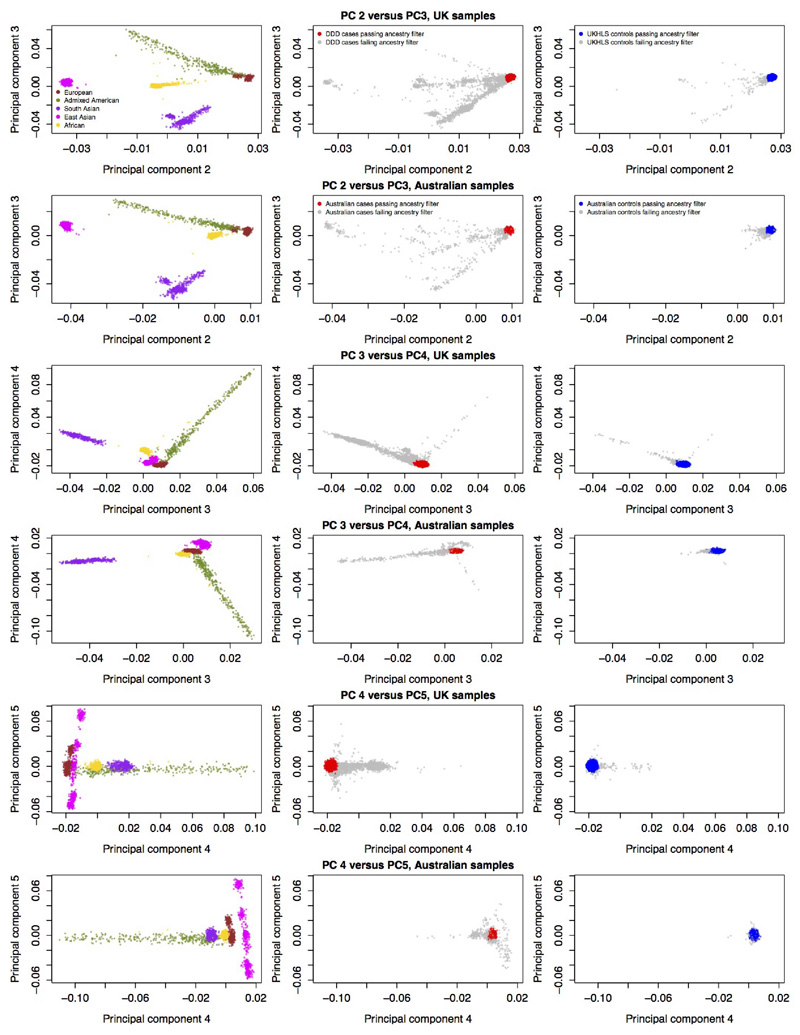
Extended Data Figure 3. Ancestry principal components analysis of UK and Australian samples (PCs 2-5).
Reference samples (N=2,504) from 1000 Genomes Phase 3, colored by the five super populations, are plotted on the left hand side, from projection PCAs with UK cohorts. Middle panels show the PCs plotted for DDD cases (discovery N=10,556 and from trios N=911) (UK samples) and Australian cases (N=2,283). Red=European ancestry case samples, grey=non-European samples, which were excluded from analyses. Right hand panels show PCs for UKHLS controls (N=10,396) (UK samples) and Australian controls (N=4,274). Blue=European ancestry control samples, grey=non-European samples, which were excluded from analyses. UK cohorts are plotted after removal of samples that failed quality control, and Australian cohorts before removal of samples that failed quality control.

