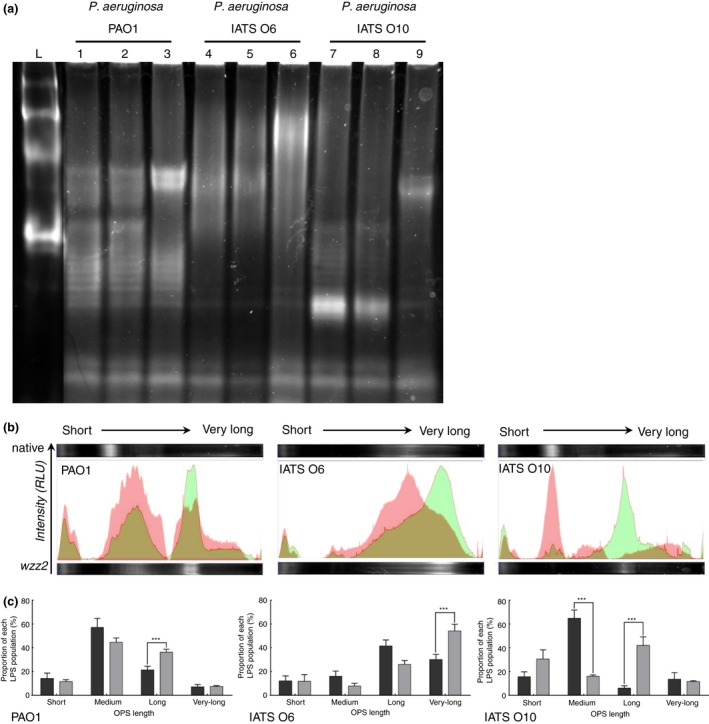
Figure 5.

(a) Visualization of LPS produced by wild‐type Pseudomonas aeruginosa strains PAO1 (lane 1), IATS O6 (lane 4) and IATS O10 (lane 7), and the same strains carrying pUCP19 (lanes 2, 5 and 8 respectively) or pUCP19‐wzz2 (lanes 3, 6 and 9 respectively). (b) Visualization of the signal intensity distribution for the wild‐type (red) and the wzz2 overexpressing (green) PAO1, IATS O6 and IATS O10 strains. (c) Proportion of each OPS population relative to the total signal intensity per lane for wild‐type (dark grey) and wzz2 overexpressing (light grey) strains of PAO1 (left), IATS O6 (middle) and IATS O10 (right). [Colour figure can be viewed at wileyonlinelibrary.com]
