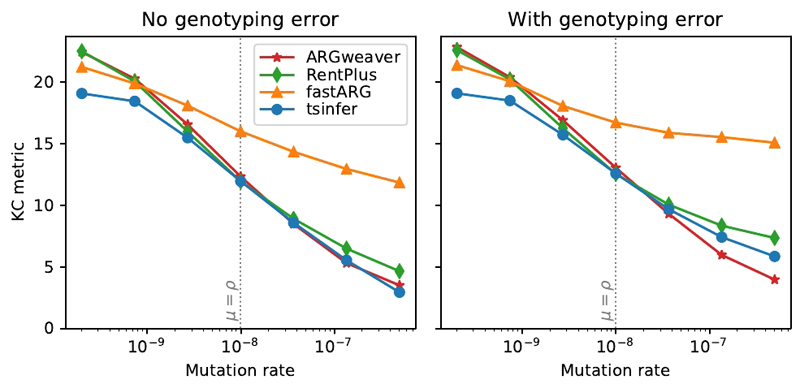
Figure 3.
Accuracy of ancestry inference under different methods (lower values indicate greater accuracy). Coalescent simulations for 16 sample haplotypes of 1Mb in length under human-like parameters (Ne = 5000, with recombination rate ρ = 10−8 per base per generation) and an infinite sites model of mutation were simulated using msprime 28. The reported tree topology distance is the Kendall-Colijn metric, weighted by the genomic distance spanned by each tree. Each point is the average of 100 independent replicates at a given mutation rate. The point where mutation rate equals recombination rate (similar to humans) is marked with a vertical dotted line. Standard errors are smaller than the plotted symbols in all cases.

