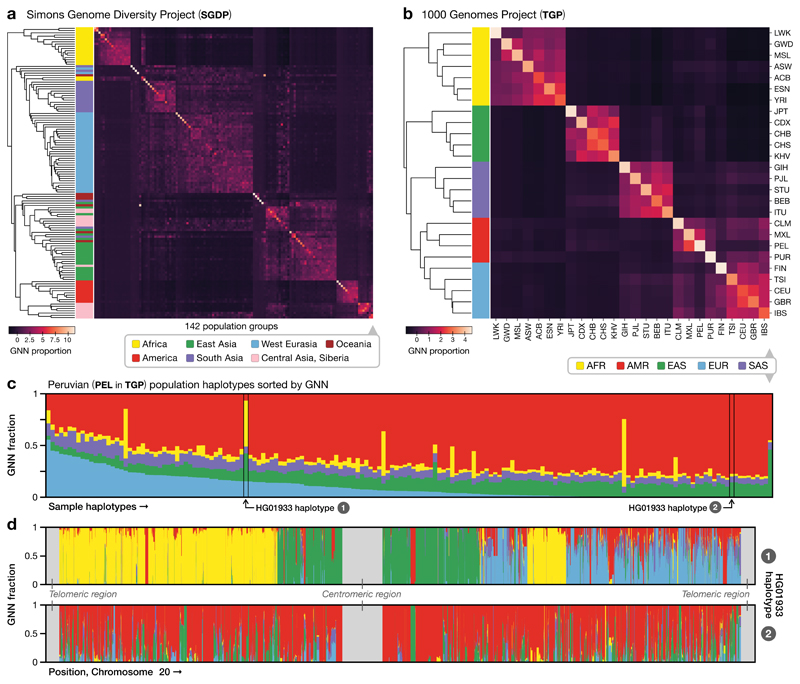
Figure 4.
Tree sequence characterisation of global genome diversity. a). Z-score normalised GNN proportions for SGDP by population (n = 278 individuals). The GNN matrix was first z-score normalised by column and the rows then hierarchically clustered. See Supplementary Figure 16 for a larger version with population labels. b). As for (a), but for the TGP data (n = 2504 individuals). c). Average GNN proportions for all individuals within the PEL population in TGP. Colours indicate continental-level groupings. d). The GNN proportions across the chromosome for the two haplotypes of HG01933, from the PEL population in TGP. HG01933 was chosen as an example of an individual showing evidence of very recent admixture from multiple source populations. We note that apparent short tracts of different ancestry most likely do not reflect true changes in recent ancestry, but arise through the stochastic nature of genealogical processes and errors in inference.

