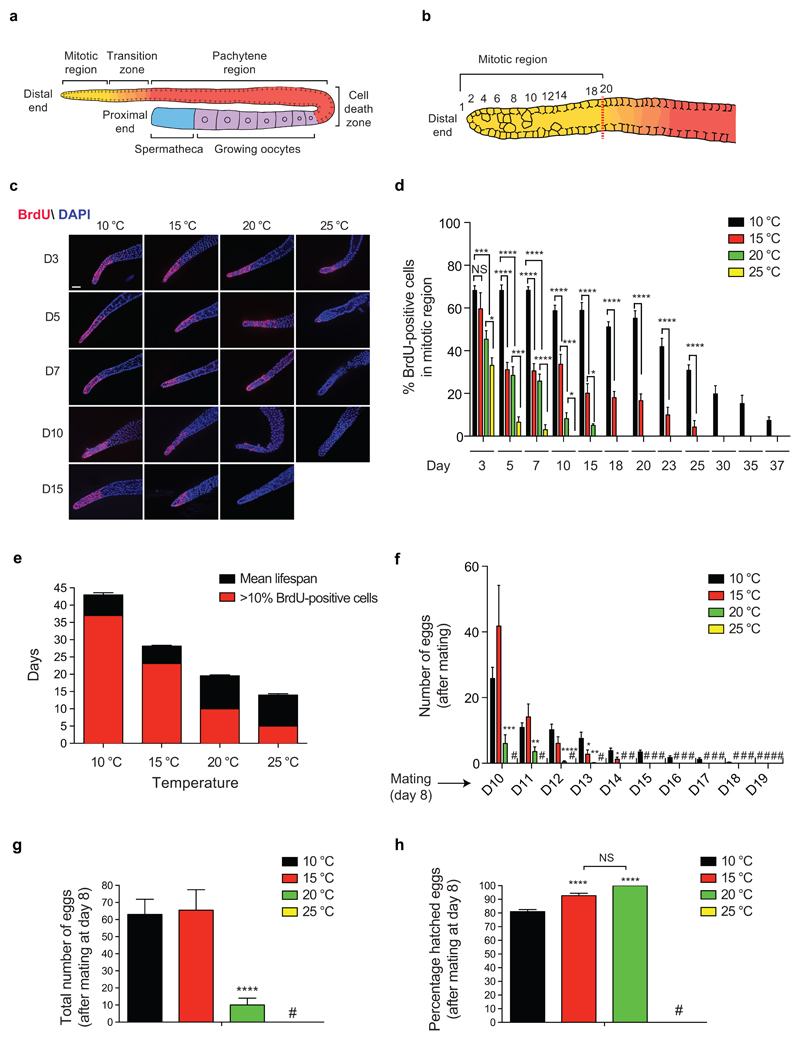
Figure 2. Cold temperature delays exhaustion of GSCs and reproductive aging.
a, Schematic representation of one gonad of the young adult hermaphrodite germ line. Germ cells are derived from proliferating GSCs located at the mitotic region. Proliferating cells enter meiosis and move proximally from the mitotic region to the meiotic zones (transition zone, pachytene). Germ cell apoptosis occurs in the germline loop region (death cell zone). GSCs generate sperm during larval stages, then switch to oocyte production during adulthood. b, Representation of the mitotic region. Red dashed line corresponds to the point at which multiple germ cells exhibit an early meiotic phenotype, considered the boundary between the mitotic region and the transition zone (row 20 of cells from the most distal cell). c, Bromodeoxyuridine (BrdU) staining of proliferating germ cells. Wild-type C. elegans were shifted to the distinct temperatures during adulthood and the germ lines were extruded after 2 h BrdU treatment at the indicated day (D) of age. Cell nuclei were stained with DAPI. Scale bar represents 20 µm. The images are representative of 4 independent experiments. d, Graph represents the percentage of BrdU-positive cells/total nuclei within the mitotic region (mean ± s.e.m., 10°C D3-37, 15°C D3-23 (n=20 germ lines), 15°C D23, 20°C D3-15, 25°C D3-10 (n= 15), germ lines were scored from 3 independent experiments). We did not examine the germ line after D15 at 25°C, D18 at 20°C, D25 at 15°C and D37 at 10°C as the percentage of BrdU-positive cells was below 10% at these ages/temperatures. NS= not significant (P=0.3322). e, Graph represents the average ± s.e.m. of the mean lifespan at 10°C (n= 15 independent experiments), 15°C (n= 56), 20°C (n= 29) and 25°C (n= 22). The graph also indicates until what day of the respective mean lifespan is germ cell proliferation maintained at each temperature (>10% BrdU-positive cells in the mitotic region), as inferred from the data presented in the previous panel. f, Adult worms were cultured at the indicated temperature during adulthood. After the self-reproductive period, worms were mated at day 8 of adulthood with young males raised at 20°C and kept at the respective temperatures. Graph represents the number of eggs laid per worm every 24 h after mating (mean ± s.e.m., n= 24 worms scored per condition from 3 independent experiments). (#) no eggs were laid. g, Total number of eggs laid per worm at different temperatures after mating at day 8 of adulthood (mean ± s.e.m., n= 24 worms from 3 independent experiments). (#) no eggs were laid by mated worms at 25°C. h, Percentage of hatched eggs at different temperatures (mean ± s.e.m., n= 24 worms from 3 independent experiments). The percentage of viable eggs after mating is similar at 15°C and 20°C (NS= not significant, P=0.0715). Although egg hatching decreases at 10°C, most of the eggs (81%) were still viable. (#) no eggs were laid. Statistical comparisons were made by two-tailed Student’s t-test for unpaired samples. P-value: *(P<0.05), **(P<0.01), ***(P<0.001), ****(P<0.0001).

